BCH/USD daily chart
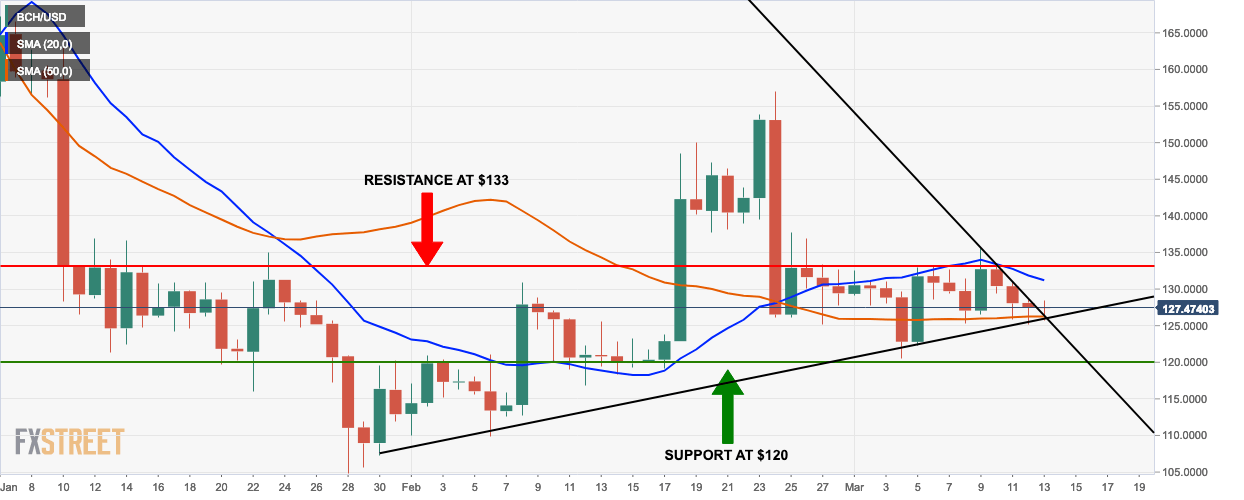
- BCH/USD had a bearish breakout from a triangle formation and is currently trading for $127.50.
- The market is sandwiched between the 20-day simple moving average (SMA 20) and SMA 50.
- The SMA 20 has already crossed over the SMA 50 which is a sell sign.
BCH/USD 4-hour chart
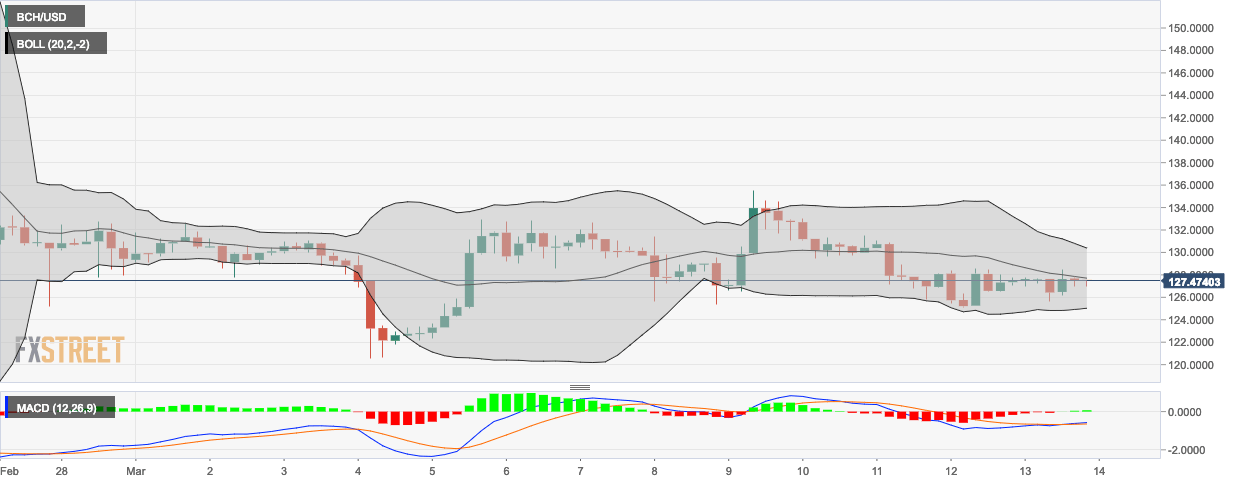
- The BCH/USD 4-hour chart shows that the market is trending in the middle of the 20-day Bollinger band. Even though the last session is bearish, this indicates that the bears don’t have much momentum.
- The moving average convergence/divergence (MACD) shows that bearish momentum has reversed.
BCH/USD hourly chart
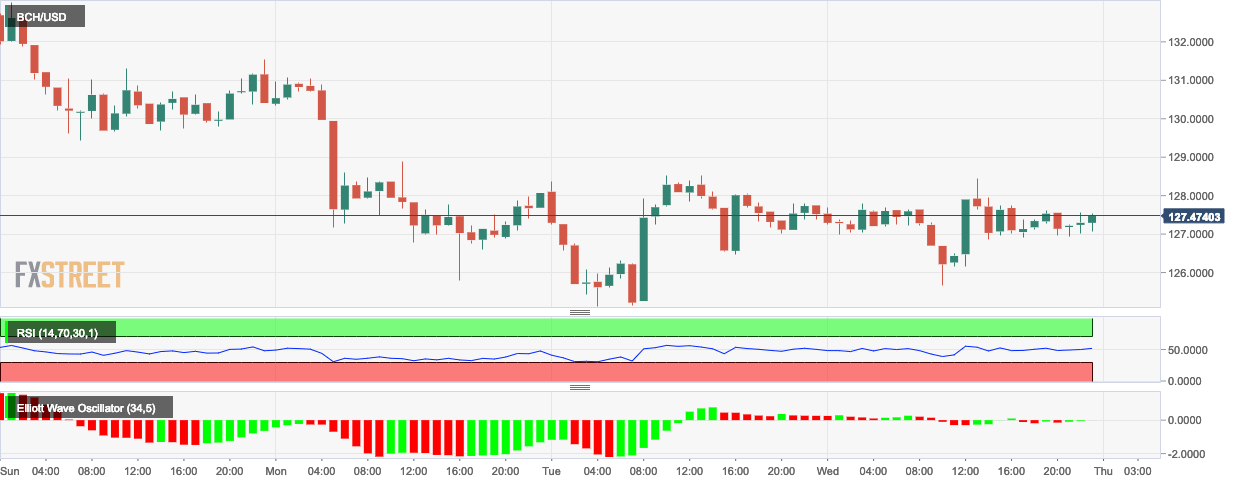
- The Elliot wave oscillator in the hourly BCH/USD chart shows that the market’s volatility is decreasing.
- The relative strength index (RSI) graph is trending in the neutral zone.
Key Levels
- Resistance 3: $132.4006
- Resistance 2: $130.4683
- Resistance 1: $128.9942
- Pivot Point: $127.0619
- Support 1: $125.5877
- Support 2: $123.6554
- Support 3: $122.1813
