- Like most cryptocurrencies Bitcoin cash is lower today, currently trading down 0.47%.
- The hourly chart is still bullish but the psychological 300 support level is in sight.
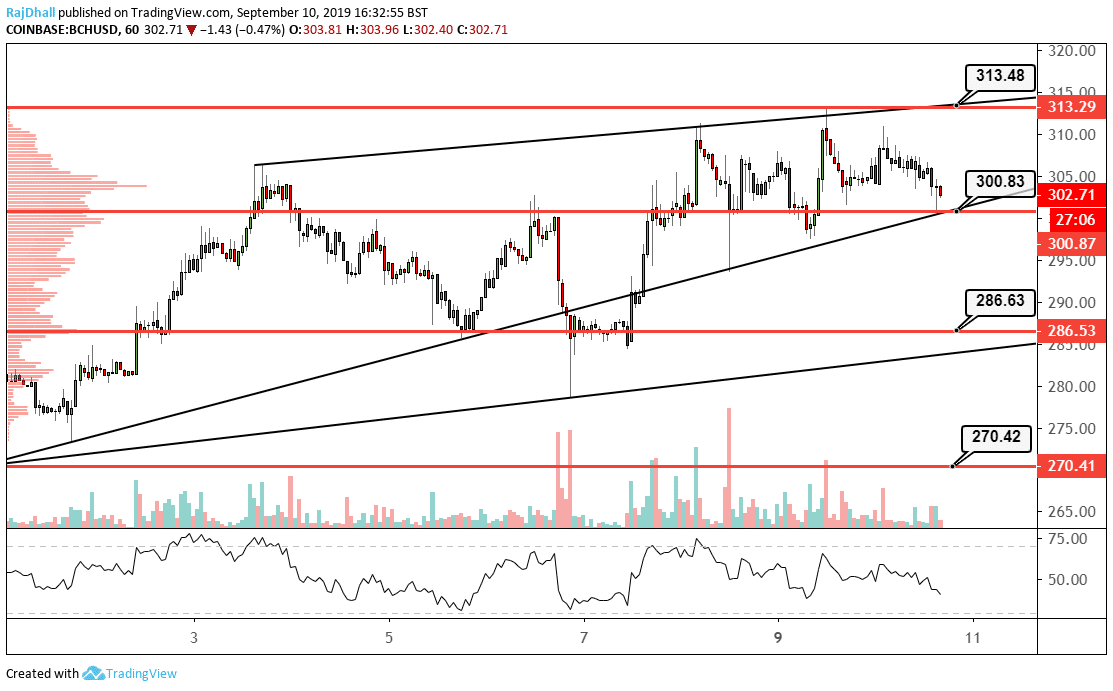
Bitcoin Cash is managing to hold on to the 300 level for now but how long will it last.
On the hourly chart the BCH/USD price is looking slightly toppy after consolidating between 310 and 305 today but the support levels on the chart look like they might be tested soon.
All the volume spikes on the bottom of the chart have come when the price is selling off.
Having said that this is still a bullish chart, for now. The price has been making higher high and higher lows but if the psychological 300 level breaks to the downside it will make a lower high and lower low formation.
The RSI indicator has also just dipped under the 50 mid point and could have more room for a move further south.
If 300 breaks the next support on the downside could be 286.63. which was used twice to good effect on the 6th and 7th of this month (Sept).
