GBP/USD is consolidating its losses below 1.3100 after yet another devastating defeat for Prime Minister Theresa May and her amended Brexit accord. The next vote is coming up today when MPs are projected to reject a no-deal Brexit. How is cable positioned? The downside looks more appealing.
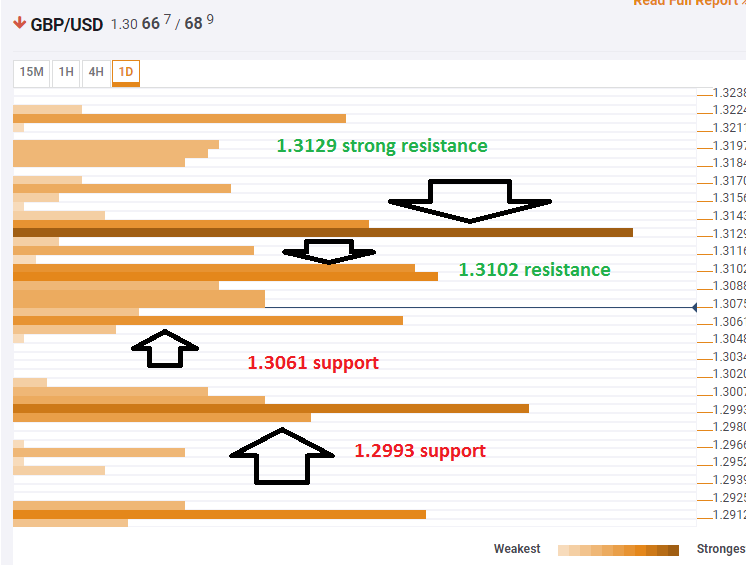
The Technical Confluences Indicator shows that the pound has initial support at 1.3061 where the previous 4h–low, the Fibonacci 23.6% one-week, and the Simple Moving Average 200-4h converge.
More significant support is at 1.3000 where we see the convergence of the SMA 200-1d, the SMA 50-1d, last week’s low, and the Fibonacci 61.8% one-month.
Looking up, GBP/USD is capped around 1.3102 which is the confluence of the Fibonacci 38.2% one-week, the SMA 5-1d, and the previous 1d-high.
The most substantial cap awaits at 1.3129 where a dense cluster including the SMA 100-15m, the SMA 100-4h, the Bollinger Band 1h-Middle, and the Fibonacci 38.2% one-month await the pair.
All in all, resistance lines are stronger than support lines.
This is how it looks on the tool:
Confluence Detector
The Confluence Detector finds exciting opportunities using Technical Confluences. The TC is a tool to locate and point out those price levels where there is a congestion of indicators, moving averages, Fibonacci levels, Pivot Points, etc. Knowing where these congestion points are located is very useful for the trader, and can be used as a basis for different strategies.
This tool assigns a certain amount of “weight” to each indicator, and this “weight” can influence adjacents price levels. This means that one price level without any indicator or moving average but under the influence of two “strongly weighted” levels accumulate more resistance than their neighbors. In these cases, the tool signals resistance in apparently empty areas.
