- BNB shows a positive correlation with Bitcoin.
- The history implies that Bitcoin may follow BNB’s lead and break from the range to the upside.
Binance Coin, BNB, is one of the best-performing digital assets out of the top-10. The coin has gained over 7% in the recent 24 hours, though on a week-on-week basis, it is still in a red zone. At the time of writing, BNB/USD is trading at $23.50. Binance Coin takes the 8th place in the global cryptocurrency market rating with the current market value of $3.4 billion and an averaged daily trading volume of $765 million. It is most actively traded on Binance, which is hardly surprising as it is the native token of the trading platform.
Binance Coin’s correlation with crypto assets
BNB has a high positive correlation with Bitcoin and several other digital assets, including Ethereum (ETH), Dash (DASH), Monero (XMR), and Stellar (XLM). It means that the price of those assets tends to move in lockstep in most cases. According to the data, provided on the graph below, in the last seven days, BNB has had the highest correlation with BTC (0.77), and ETH (0.78) as +1 indicates a perfect linear correlation of the assets.
The correlation chart
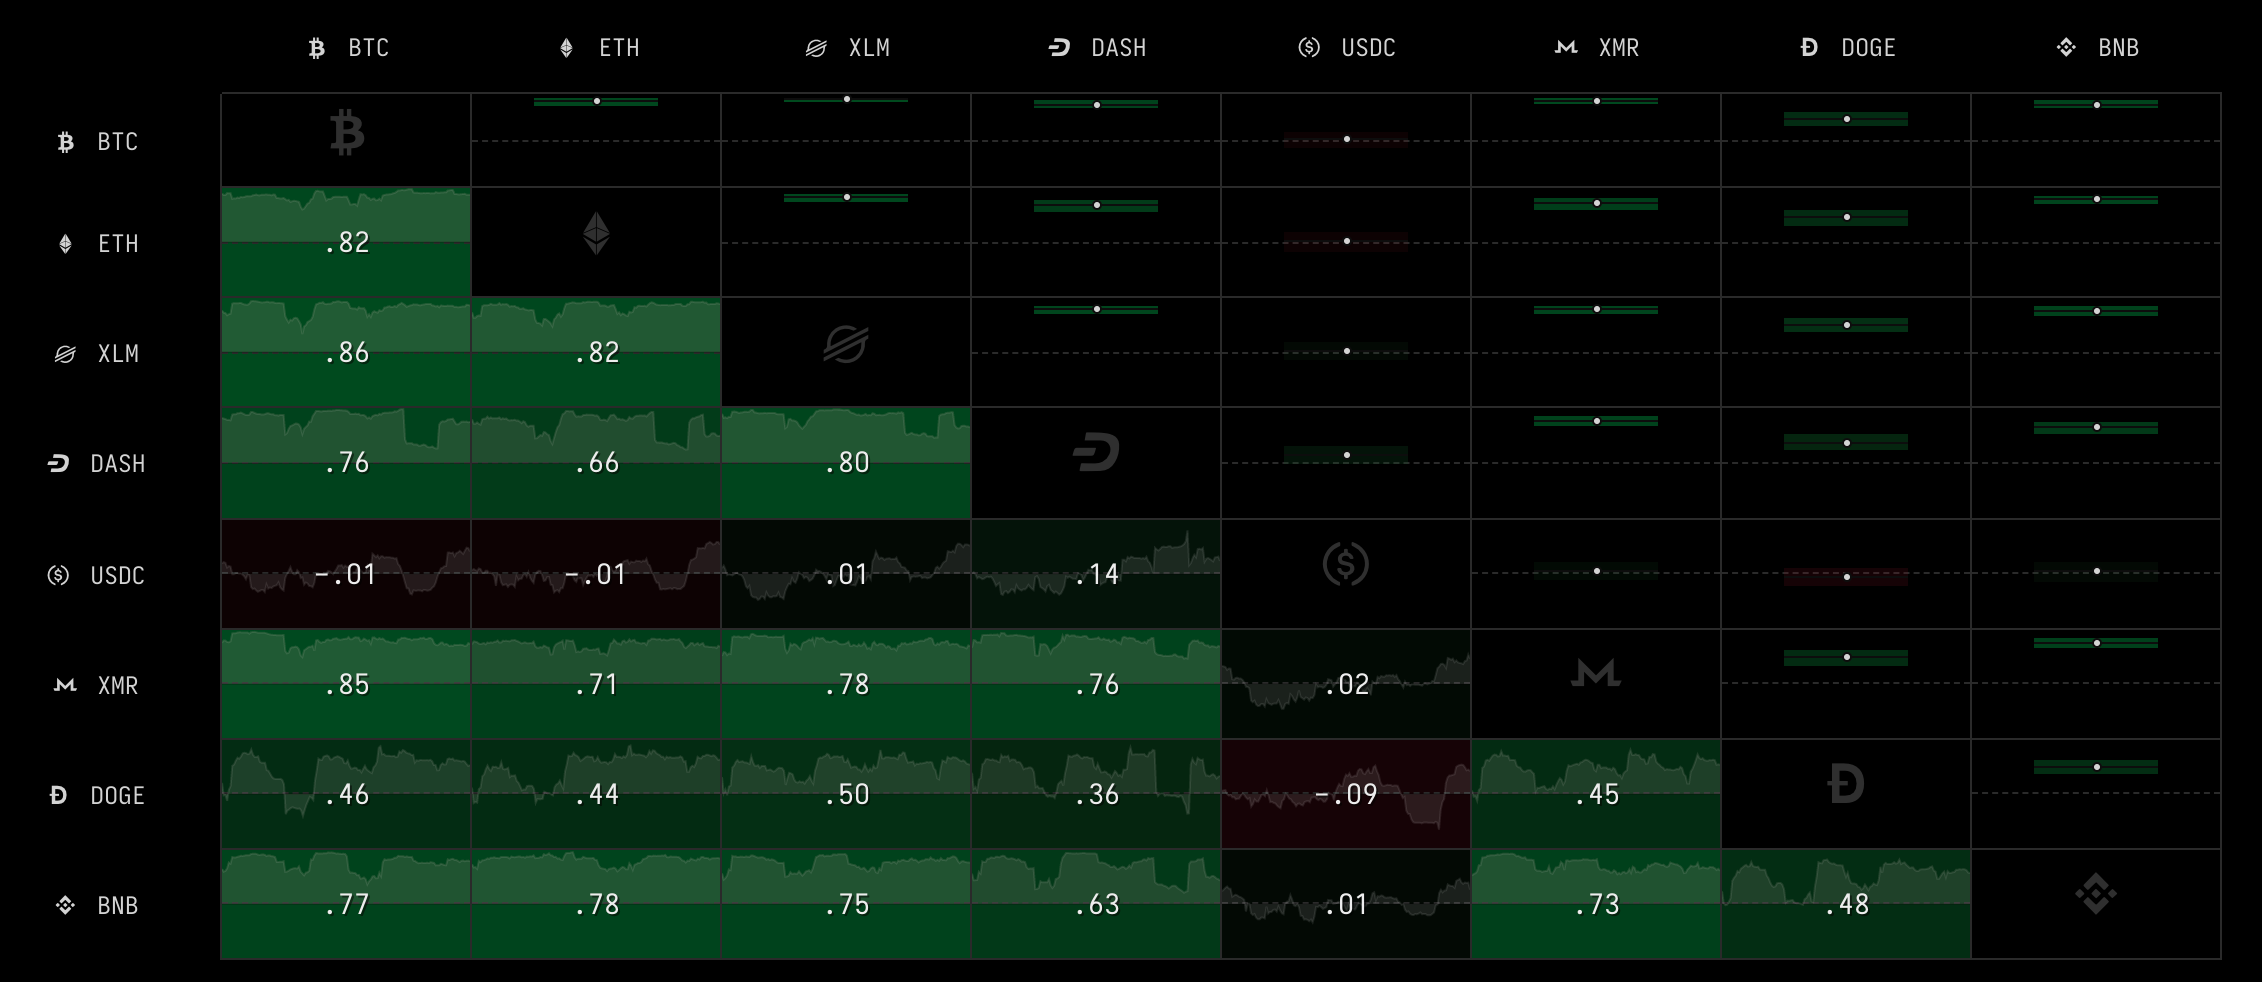
Source: Cryptowatch
If we compare the price movements of Bitcoin and Binance Coin, it becomes clear that, in some instances, the coin serves as a leading indicator for BTC. While the past price patterns do not guarantee that the history will be repeated, it is worth looking into the technical picture of the coins to assess if there is a chance that Bitcoin would follow BNB’s lead and extend the recovery.
Binance Coin and Bitcoin comparison chart
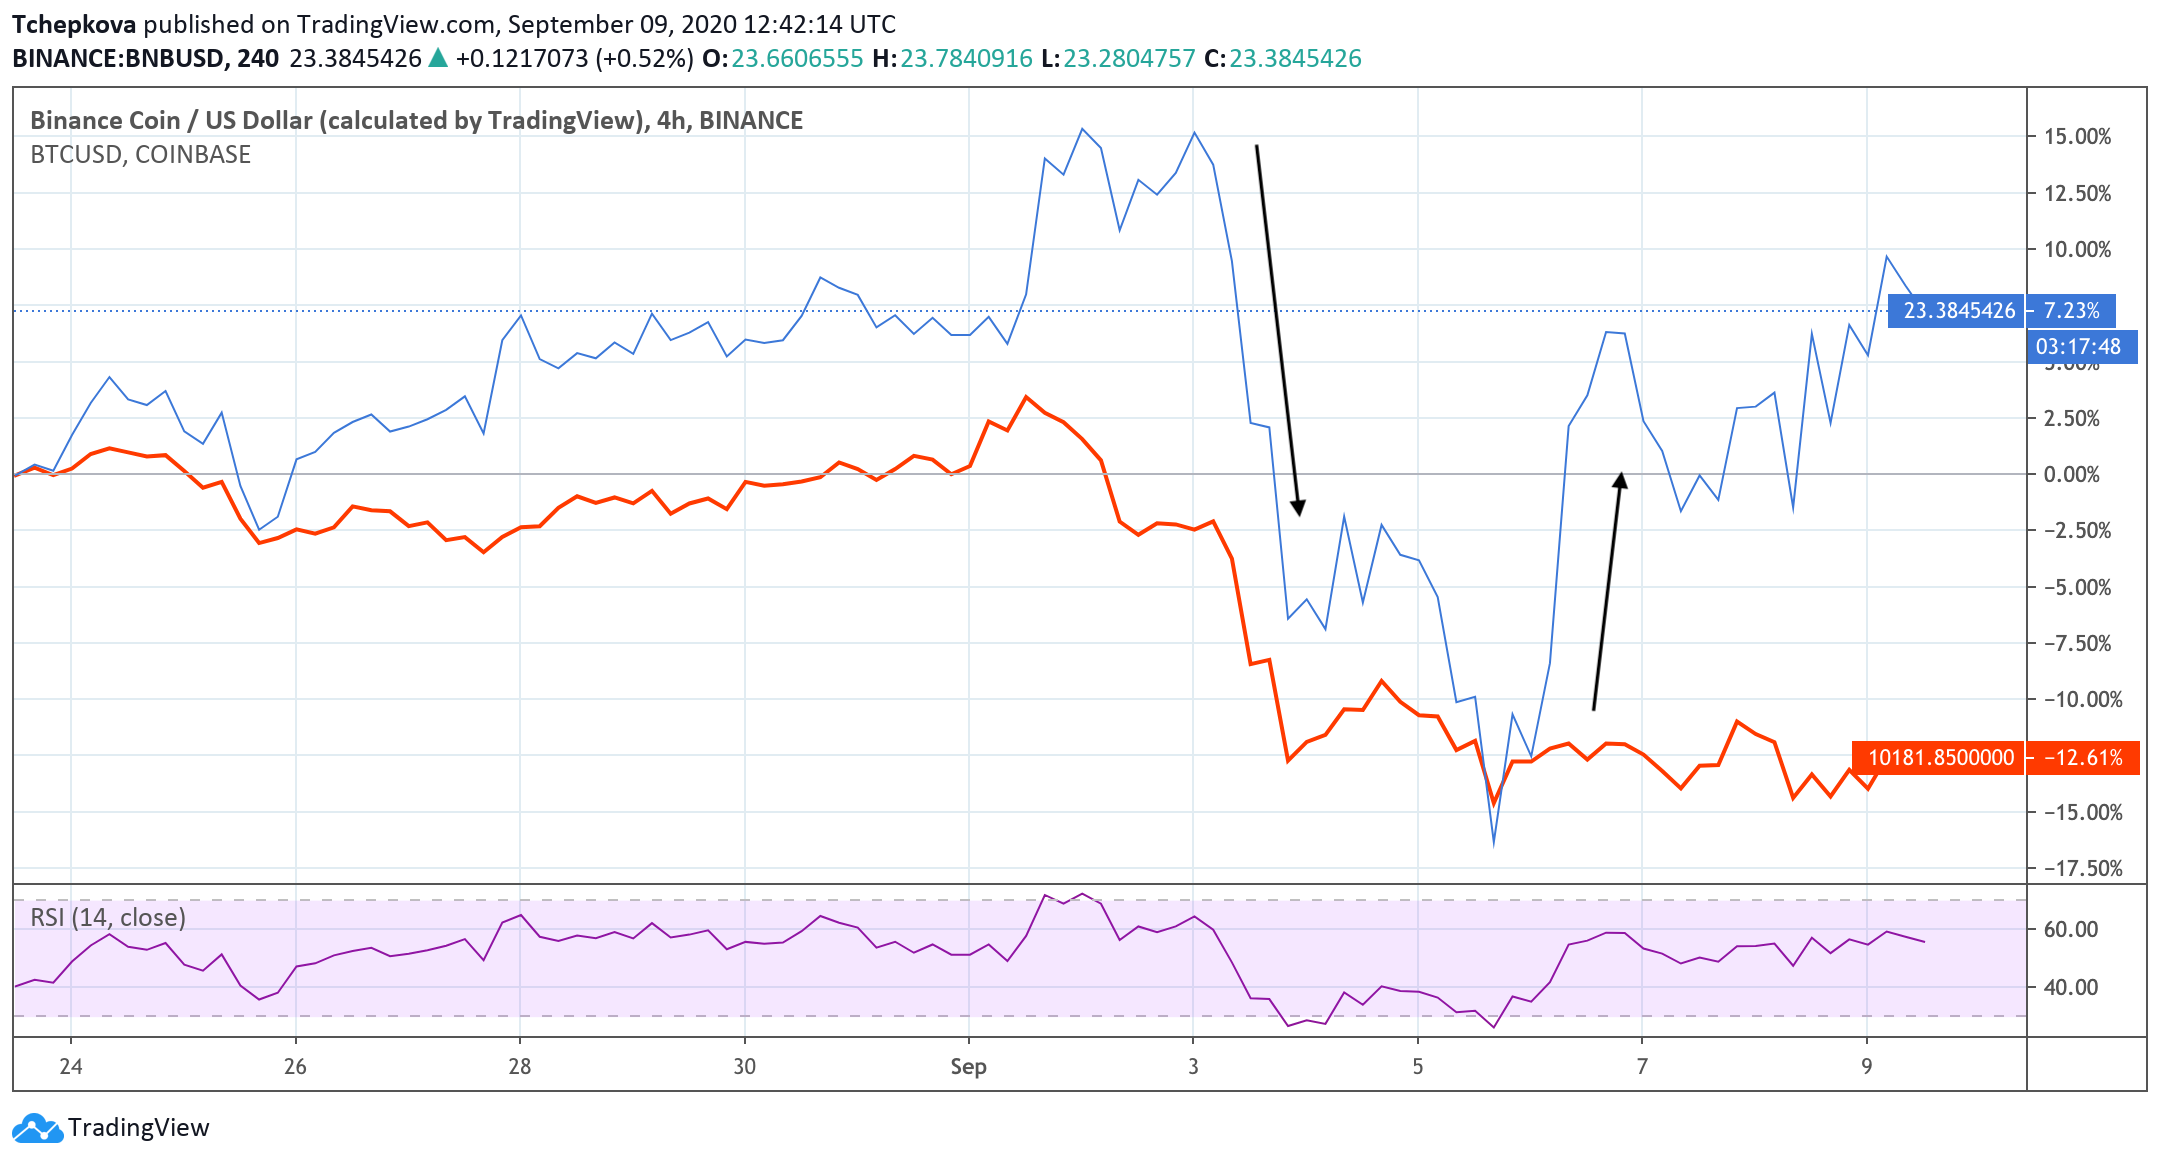
Source: Tradingview
BNB/USD: The technical picture
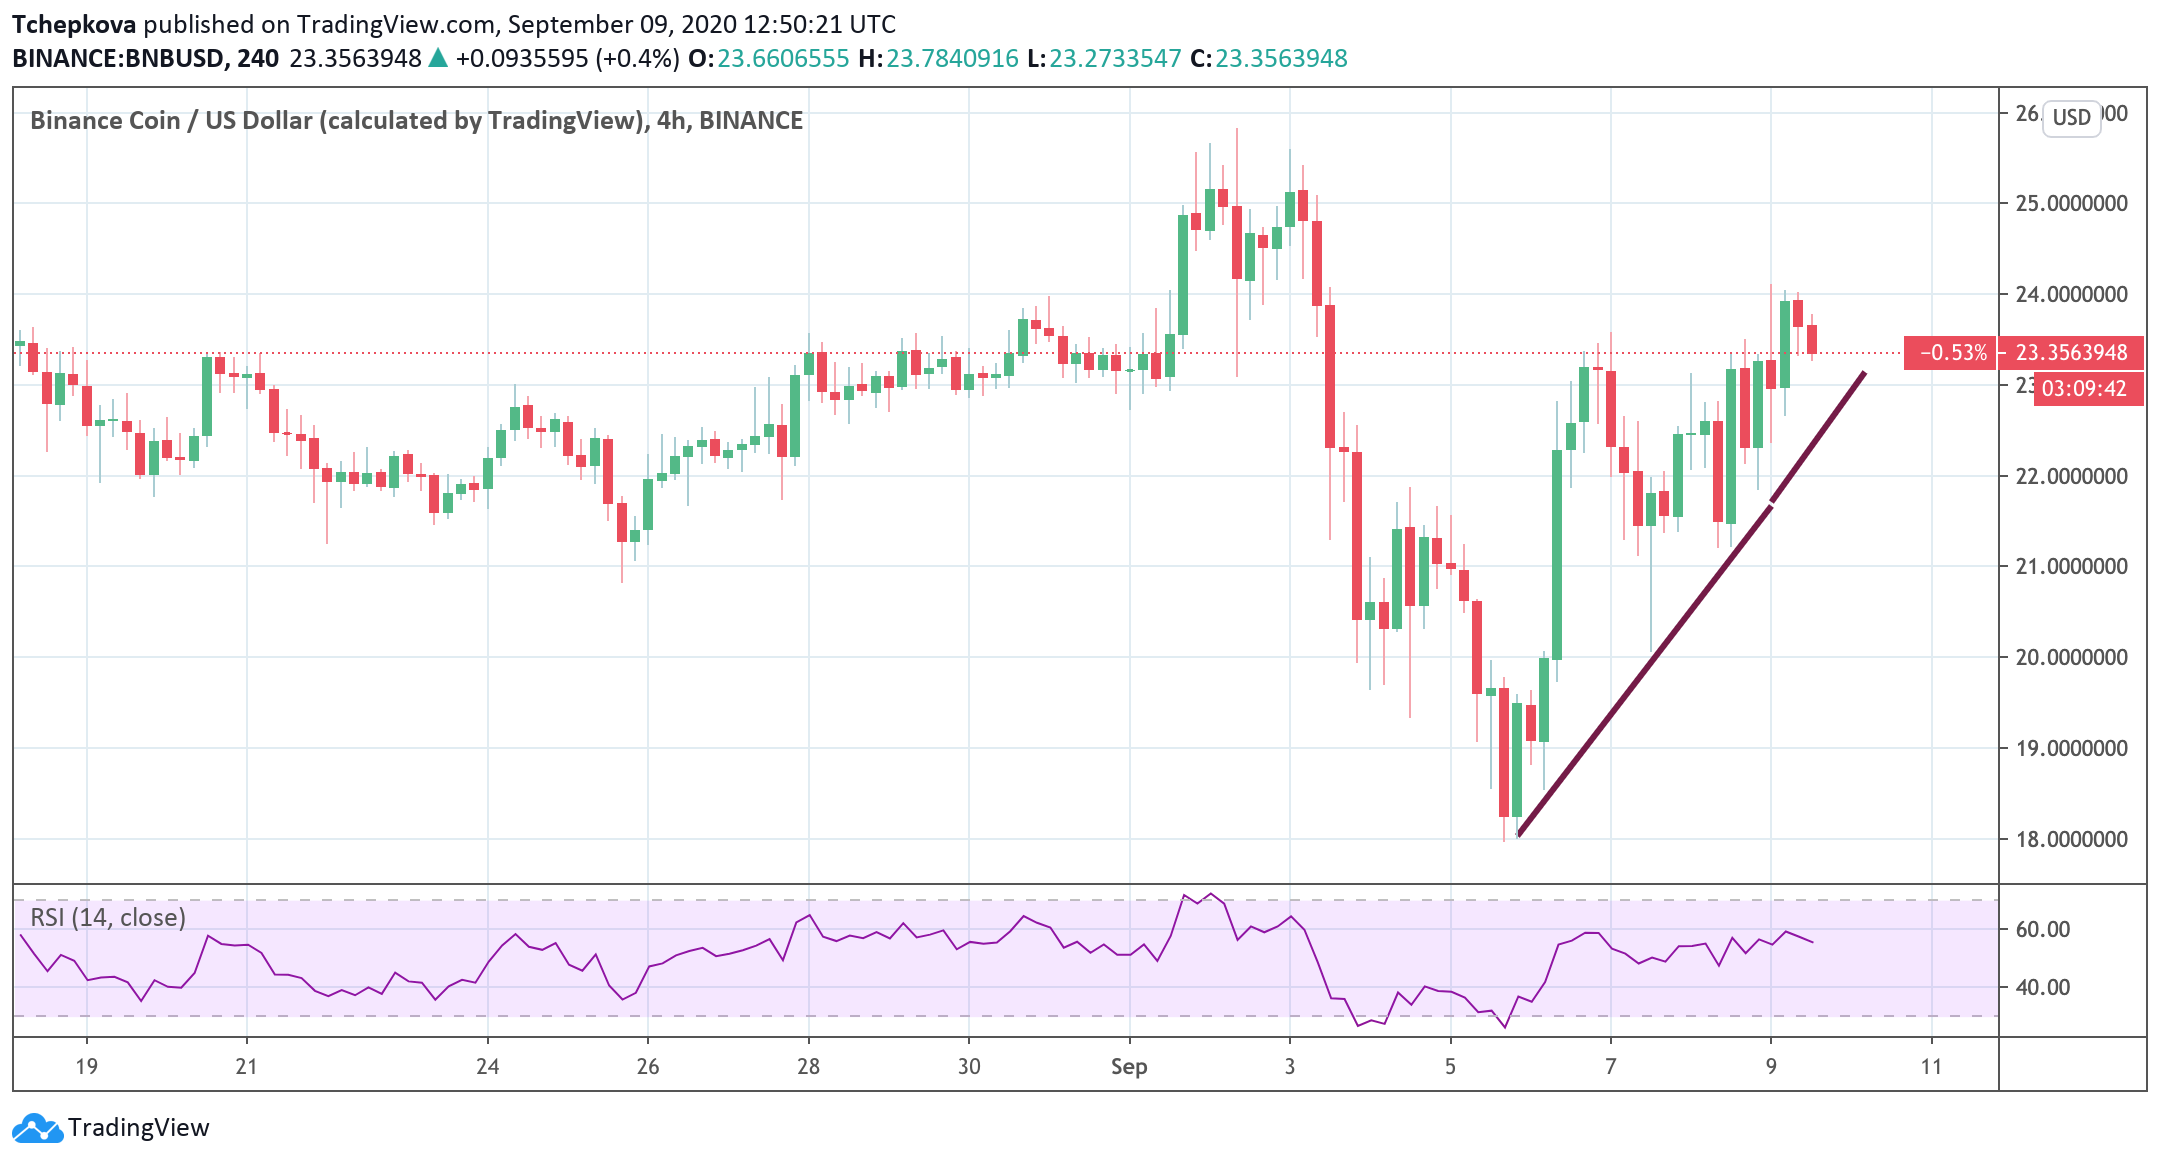
On the 4-hour chart, BNB/USD reversed from $24.00; however, it is still moving along the upside trendline with the local support at $0.22.50. If it holds, the price may retest the recent high and move towards the next bullish target at $25.80-$26.00. This barrier may slow down the recovery and push the price back inside the current range. On the other hand, a sustainable move below the said support area will open up the way to psychological $20.00 and the local bottom at $18.00.
BNB/USD 4-hour chart
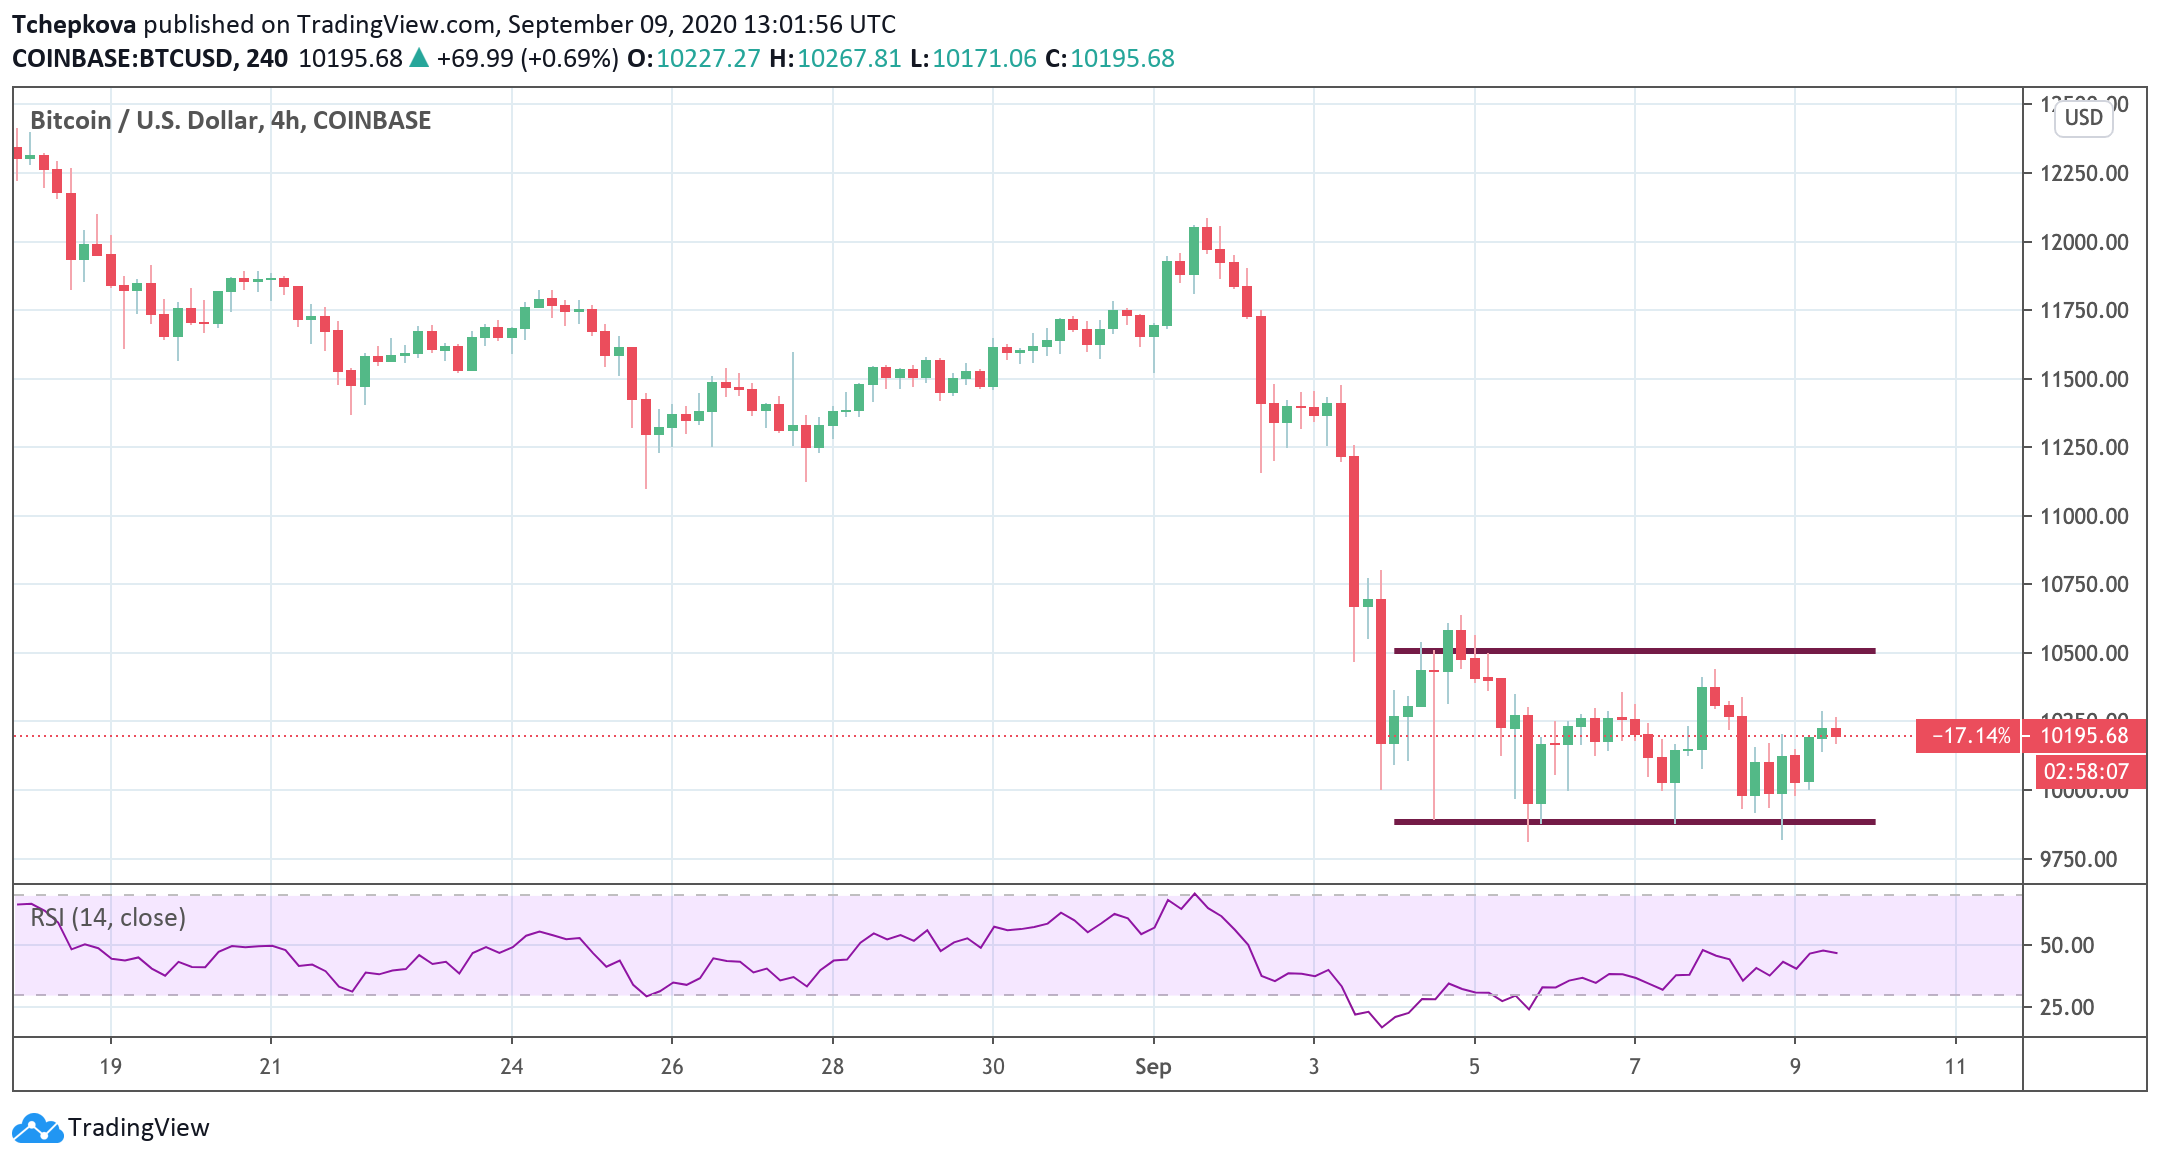
Meanwhile, BTC/USD is still locked in a range with an uncertain short-term technical picture. If the price of the first digital coin to shadow the momentum of BNB, we may see a strong recovery above $10,500 and onto $11,000 within the nearest trading sessions. A sustainable move above the later resistance will signal that the downside correction is over, and the price is ready to retest $12,0000.
On the other hand, the lack of positive momentum will negate the correlation theory and bring the lower boundary of the recent consolidation channel of $10,000 back into focus.
BTC/USD 4-hour chart