- Bitcoin price suffered a massive correction losing 15% of its value since Wednesday.
- Some analysts are predicting that BTC could even reach $5,000.
It’s not uncommon to see considerable corrections in the market after massive rallies like the one Bitcoin is experiencing. Around $80 billion were wiped out from the market in less than 24 hours, and some analysts believe the price could go even lower.
What’s the next target for Bitcoin price?
After a 15% downward correction, many analysts are posting their ideal levels and their thoughts about the pullback. Although massive corrections between 20-30% are not uncommon when Bitcoin is in a bull rally, they could be the first sign of a potential reversal.
Dyme, a popular crypto analyst on Twitter, says he is not yet prepared to go full bearish mode on Bitcoin but believes the flagship cryptocurrency is likely dropping towards the 0.382 Fib. retracement level at around $13,500. Dyme’s lowest level for Bitcoin seems to be approximately $5,433, which would still be a higher low than the crash during the coronavirus pandemic.
Other analysts are not as pessimistic and believe Bitcoin is doing something similar as it did before the 2017 massive rally to the all-time high. It seems that the Bitcoin price had several 34% corrections after reaching all-time highs throughout 2017.
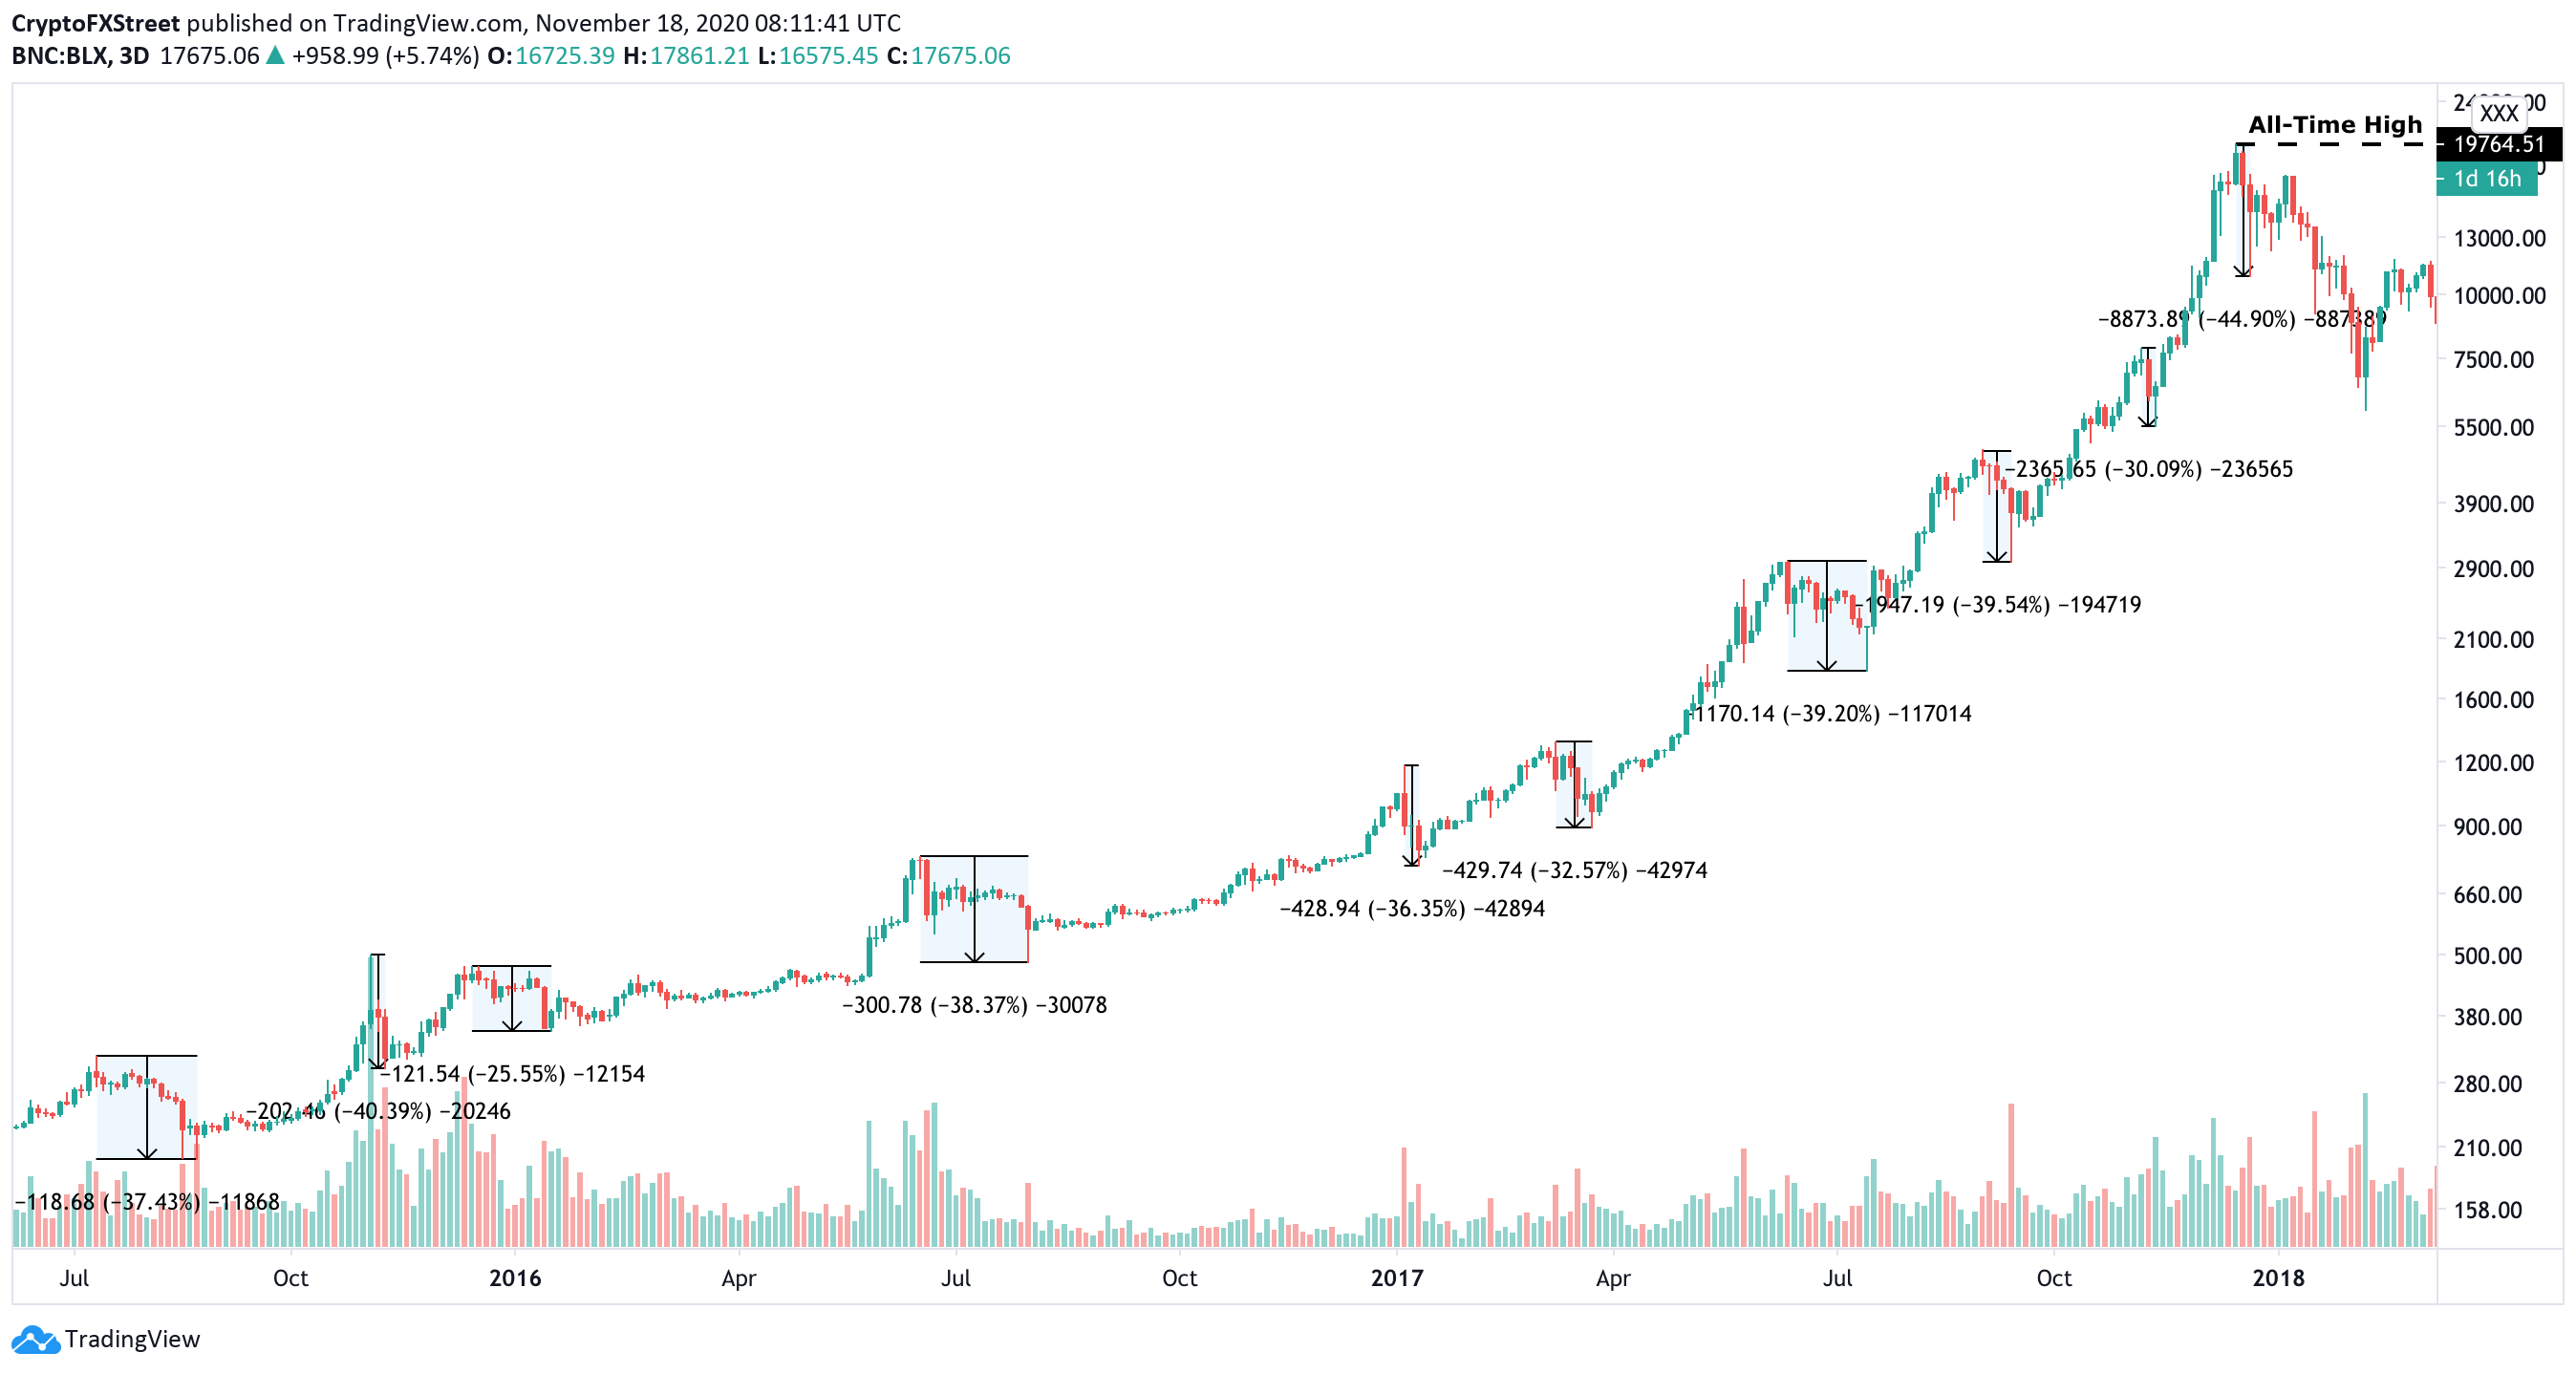
BTC/USD history of corrections
As discussed in one of FXStreet latest articles, Bitcoin is prone to suffer major corrections during bull rallies, which only end up lasting a few weeks before the next high. The current correction is only around 17%, which is significantly lower than the ones seen during 2016 and 2017. The range seems to be between 30% and 40%, which would indicate that this correction could either go lower or that it’s not a major one.
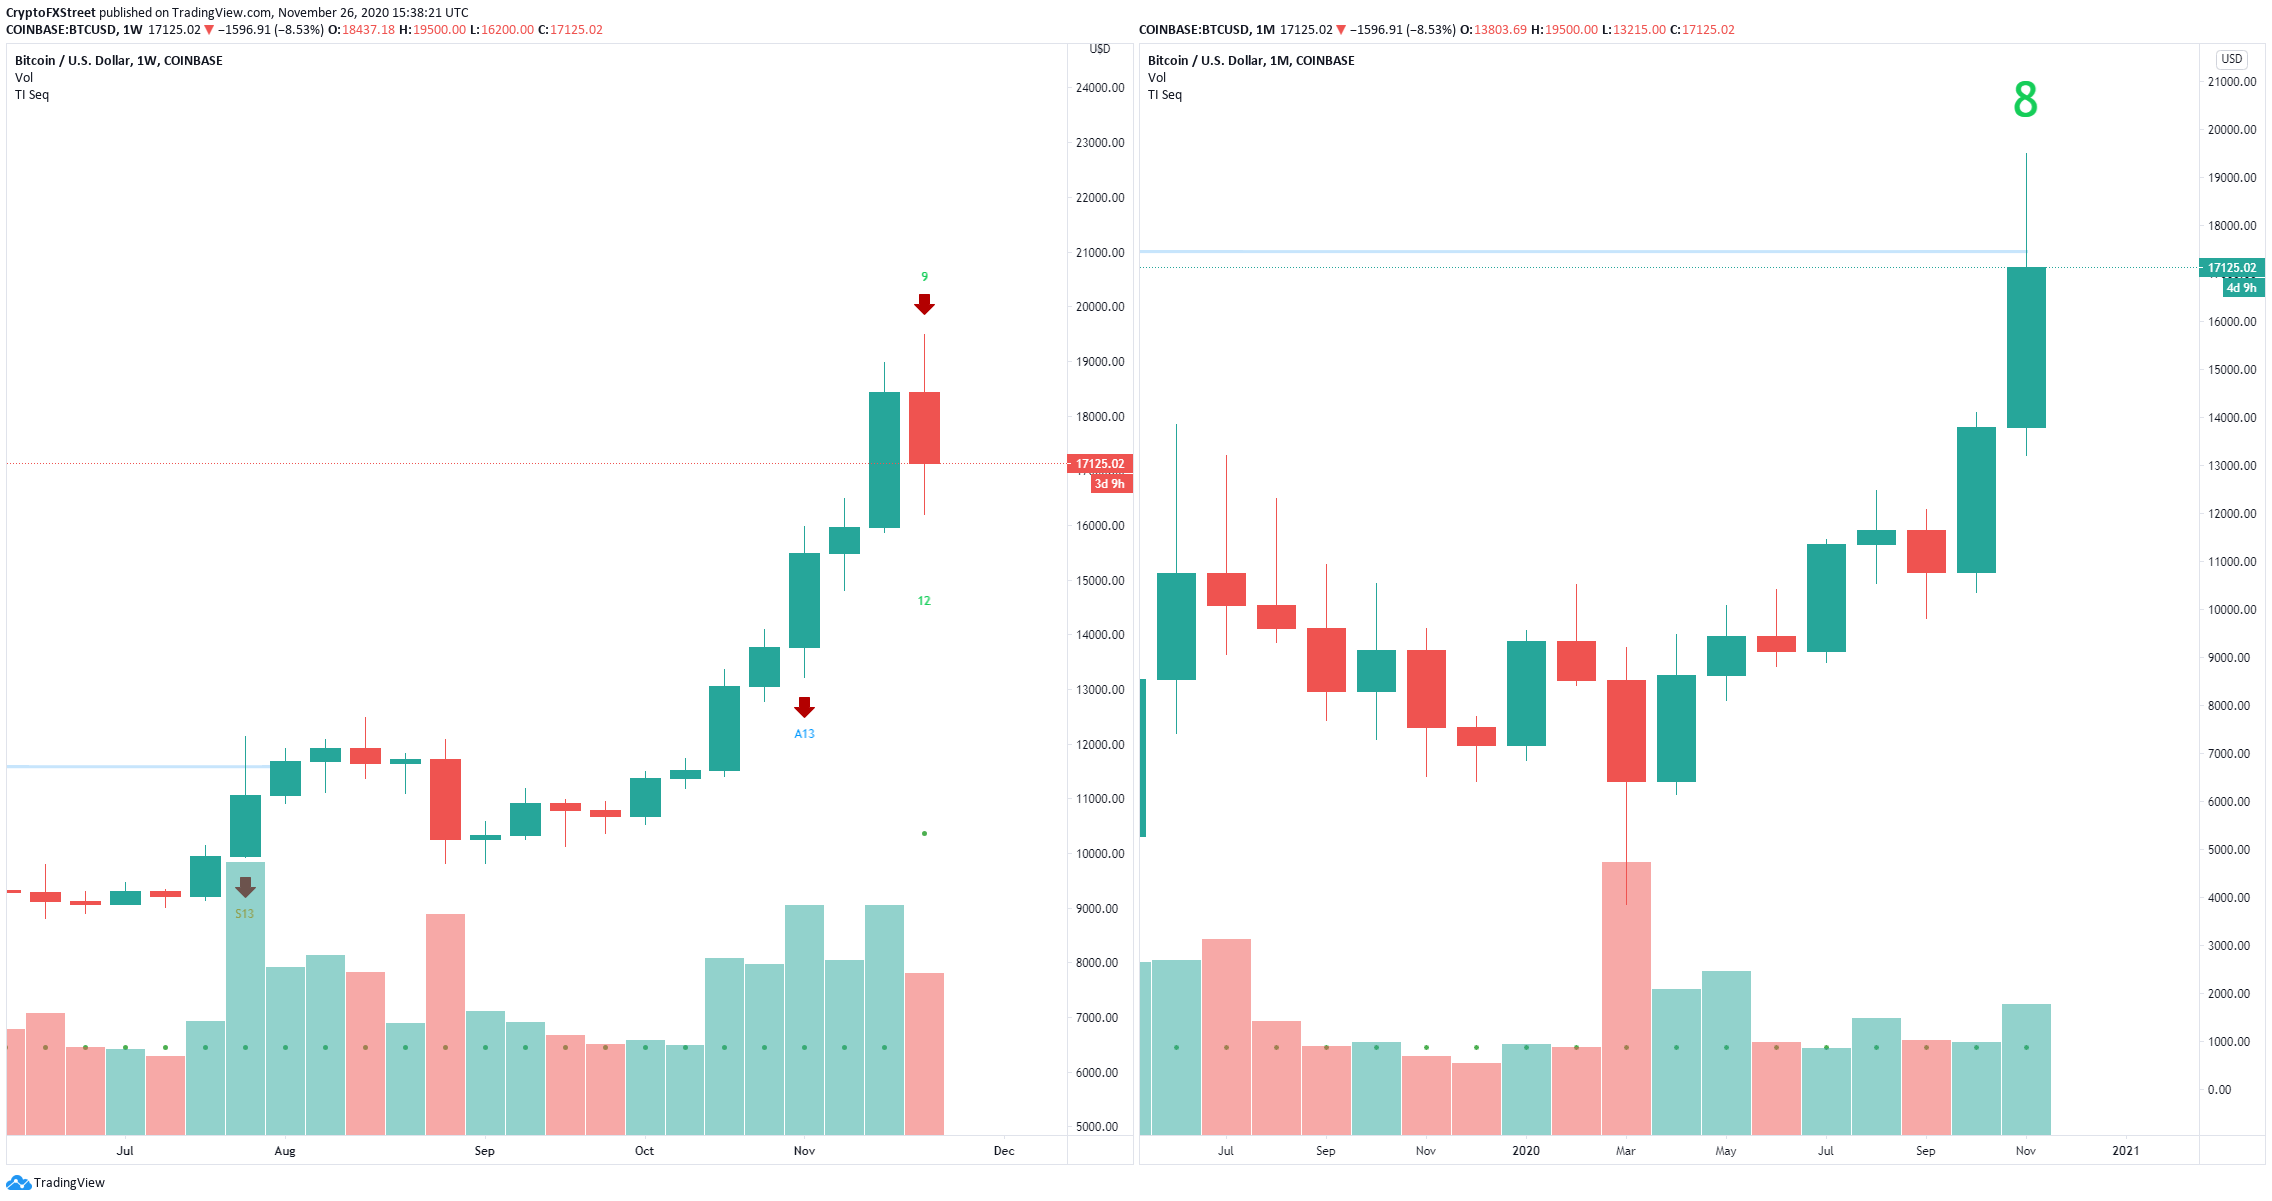
BTC/USD weekly and monthly charts
On the weekly chart, the TD Sequential indicator has just presented a sell signal for the first time since June 1, 2020. On the monthly chart, the indicator is on the verge of posting the same call, in the form of a green nine candle. This is a major indicator that a pullback is likely but doesn’t provide any price target.
IncomeSharks, another prominent Twitter analyst, states that Bitcoin has already dropped into his buy zone, which seems to be located at around $16,000. The In/Out of the Money Around Price (IOMAP) chart adds credence to this theory.
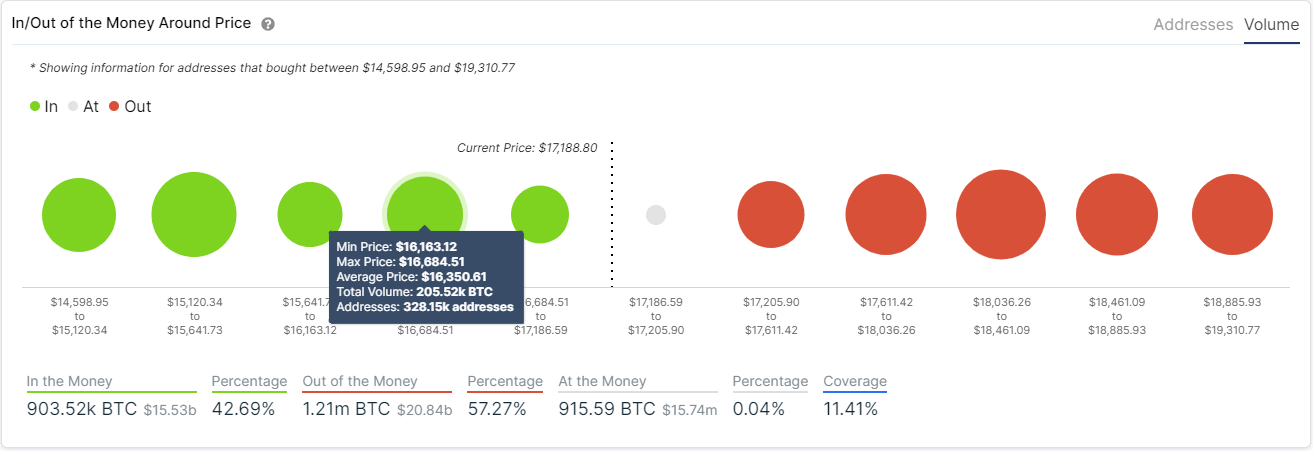
BTC IOMAP chart
According to the IOMAP chart, the area between $16,163 and $16,684, where 328,000 addresses purchased 205,000 BTC is a healthy support range. Additionally, below at around $15,417, there seems to be another vital support point.
