- Bitcoin may be vulnerable to massive losses once $8,000 is broken.
- Critical resistance is created by SMA200 on a daily chart.
Bitcoin (BTC) bulls engineers a nice recovery off the recent lows; however, SMA200 (Simple Moving Average) on a daily chart remains unconquered so far. The price of the first digital currency made a weak attempt to move above this hurdle, but it seems to be a hard nut to crack for the bulls at this stage, which is proved by a forceful retreat below $8,500 during early Asian hours on Friday.
BTC/USD, the technical picture
Bitcoin (BTC) has been trading below the above-said SMA200 since September 26. While the coin managed to recover from the recent low of $7,700, it is still moving inside a long-term bearish trend.
On the downside, the initial support is created on approach to $8,150, followed by a psychological $8,000. If it is broken, the sell-off may be extended towards the above-mentioned low strengthened bu SMA100 on a weekly chart. The next support awaits us on approach to $7,500 (the lower line of the Bollinger Band on a weekly chart). Once it is out of the way, psychological $7,000 will come back into focus.
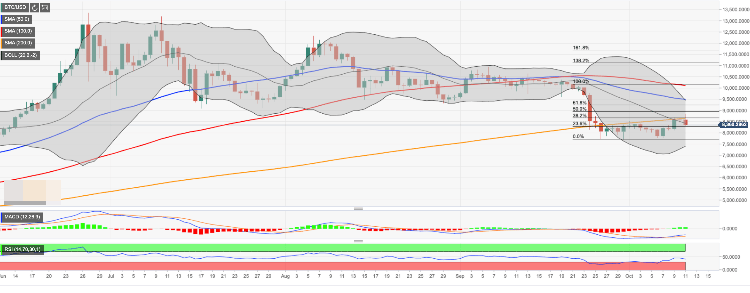
On the upside, we will need to see a sustainable move above $8,650 (SMA200 daily) for the upside to gain traction. This development will open up the way towards psychological $9,000 and $9,200. The late is regarded as a pivotal resistance level, created by 61.8% Fibo retracements for the recent sell-off.
BTC/USD, one-day chart