- BTC/USD is oscillating within the current range.
- Intraday RSI points to the short-term correction.
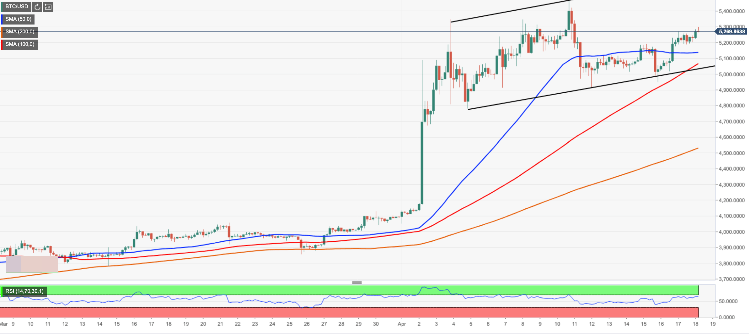
BTC/USD has been gaining ground slowly since April, 16. At the time of writing, first digital asset is hovering around $5,300 amid short-term bullish bias. BTC/USD has gained 1.2% on a day-on-day basis and 1% since the beginning of Thursday moving within the recent upside channel.
Bitcoin’s technical picture
From the intraday point of view, BTC/USD stays above SMA50 4-hour (currently at $5.138). This area now serves as an initial support. Once it is broken, the sell-off may extended towards a strong psychological barrier $5,000 strengthened by the lower boundary of the recent upside channel and SMA100 (4-hour).
On the upside, we will need to see a strong above $5,360, created by 23.6% Fibo retracement weekly and 161.8% Fibo projection daily. Meanwhile, an ultimate resistance comes at $5,448 (the recent high). It is followed by psychological $5,500.
Meanwhile, the Relative Strength Index (RSI) on 1-hour and 4-hour charts has reversed downward, moving away from an overbought territory. It means that BTC/USD is vulnerable to bearish correction within the recent range.
BTC/USD, 4H chart