- Bitcoin Cash price late on Thursday is trading in the red, down some 0.80%.
- BCH/USD price is gunning for a retest of a breached descending wedge formation.
- Should the upper part of the pattern remain intact, then the bulls could use this as a platform to spring higher.
Spot rate:
Relative change: -0.85%
High: 132.71
Low: 129.44
Trend: Bearish/Neutral
Trends:
Daily SMA20: 132.6837
Daily SMA50: 126.13
Daily SMA100: 135.7495
Daily SMA200: 309.32
Levels:
Previous Daily High: 133.068
Previous Daily Low: 128.5558
Previous Weekly High: 156.9334
Previous Weekly Low: 125.1897
Previous Monthly High: 156.9334
Previous Monthly Low: 109.9144
Daily Fibonacci 38.2%: 130.2795
Daily Fibonacci 61.8%: 131.3444
Daily Pivot Point S1: 128.5938
Daily Pivot Point S2: 126.3187
Daily Pivot Point S3: 124.0816
Daily Pivot Point R1: 133.106
Daily Pivot Point R2: 135.3431
Daily Pivot Point R3: 137.6182
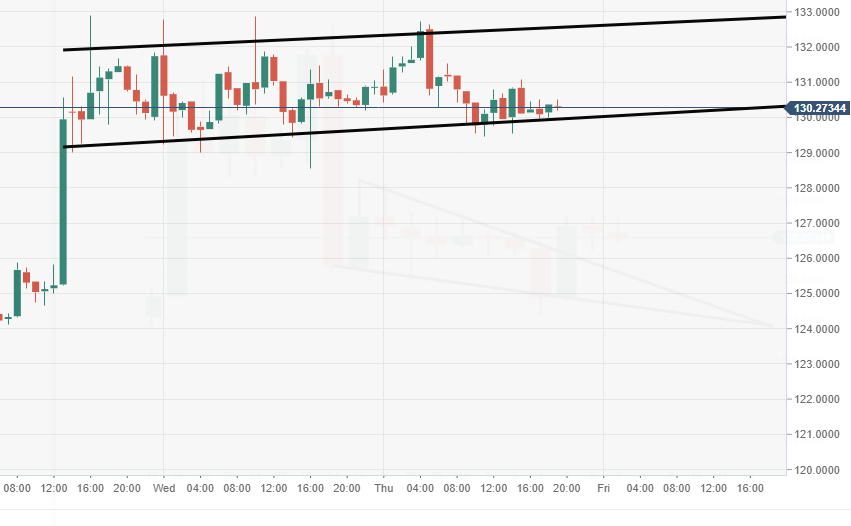
BTC/USD 60-minute chart
- Price action via the 60-minute chart is moving within somewhat of a bullish flag pattern.
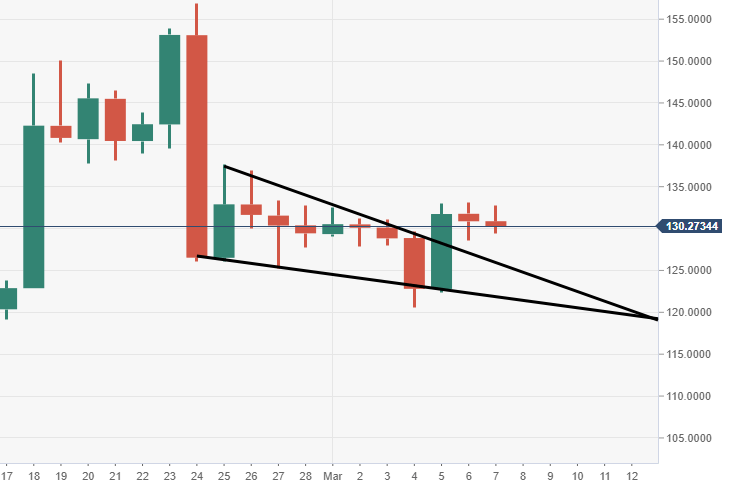
BTC/USD daily chart
- Bears are making good way for a retest of the breached descending wedge formation.