- Bitcoin Cash price was licking its wounds on Wednesday, down some 1.5% in the session.
- BCH/USD price action has formed a descending wedge pattern.
- Price range is narrowing indeed, however this could very well be positioning ahead of breakout higher.
- Eyes on key near-term support 455.4, with resistance seen at 465.3, key areas of wedge formation.
BCH/USD 4-hour chart
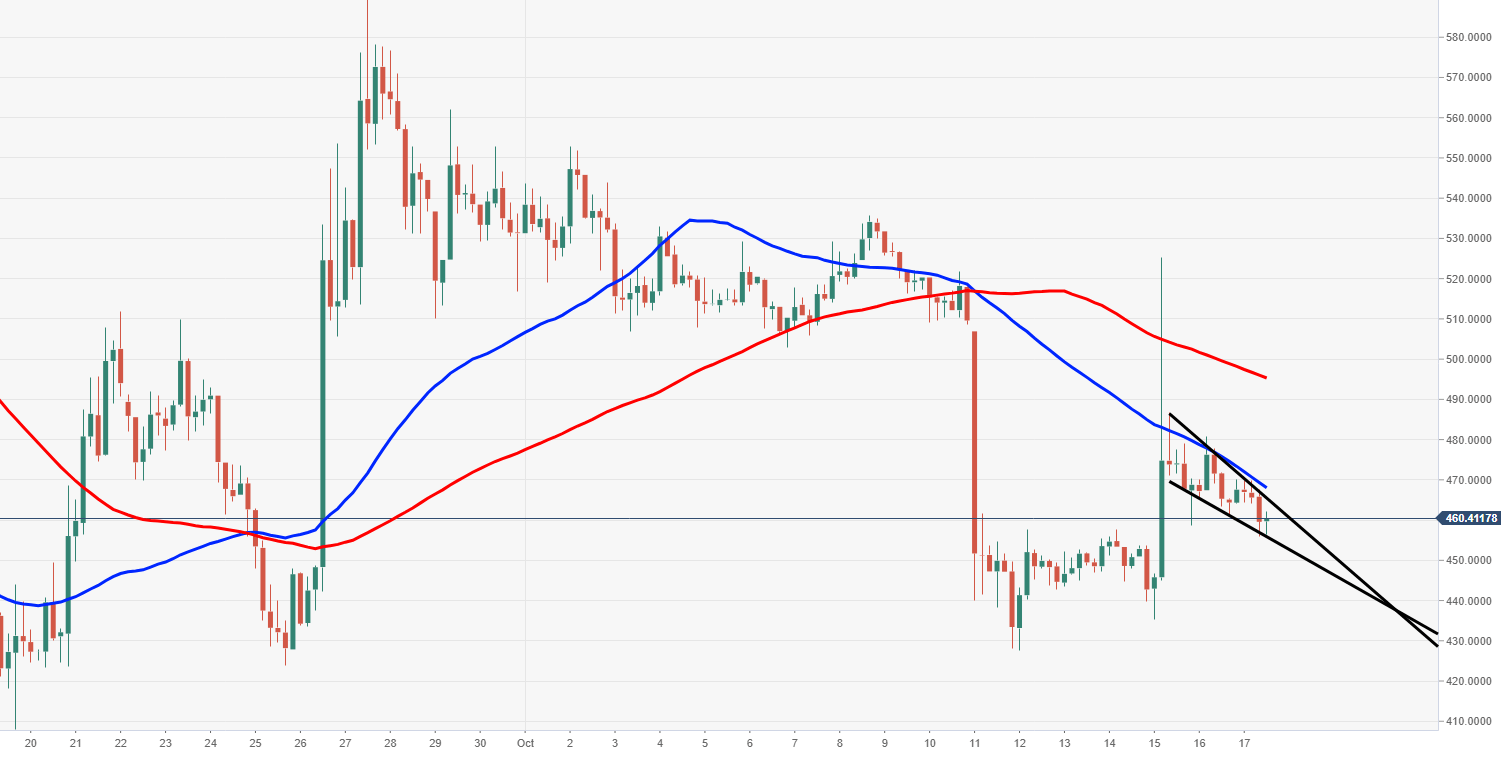
Spot rate: 460.2
Relative change: -1.55%
High: 472.1
Low: 457.4
Trend: Bearish
Support 1: 455.4, lower part of wedge.
Support 2: 440.0, demand area.
Support 3: 427.6, 12 October low.
Resistance 1: 465.3, upper part of wedge.
Resistance 2: 468.0, 50MA (4-hour).
Resistance 3: 480.4, resistance on 4-hour chart.
