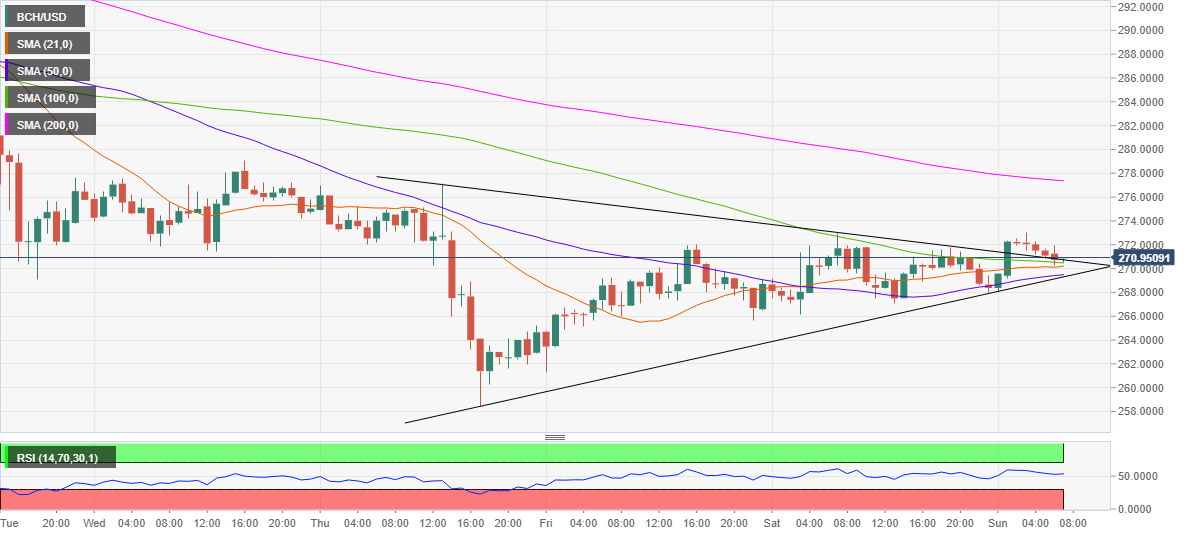
- BCH/USD off the highs, but bullish bias intact.
- No. 6 coin sees a symmetrical triangle on hourly chart.
- 200-HMA likely to be tested in the near-term.
Bitcoin Cash (BCH/USD) caught a fresh bid-wave in early trades this Sunday and rose as high as $273.02 before reversing towards $270 levels, where it now wavers.
Despite the minor pullback from daily highs, the spot trades nearly 1% higher on a daily basis, enjoying a market capitalization of $5.08 billion.
The bulls are gathering pace for the next push higher, especially in the wake of a symmetrical triangle breakout confirmed on the hourly chart after the coin closed the hour above falling trendline (pattern) resistance, then located at $271.30.
The buyers now aim for the pattern target at $290. Ahead of that level, the 200-hourly Simple Moving Average (HMA) at $277 will be the level to beat for the BCH bulls.
Alternatively, a cluster of critical support at $270 should cushion the downside. That level is the confluence of the pattern resistance now turned support, 21 and 100-HMAs.
A break below which the next support at $269 will be put to test. Friday’s low of $266.10 will be next on the sellers’ radar.
BCH/USD: Hourly chart
BCH/USD: Additional levels to consider
