- Bitcoin Cash price seems to finally catch up to the market reaching a price of $372 in the past 24 hours.
- The digital asset could be facing some short-term selling pressure.
BCH was trading sideways throughout October and most of November until a massive 20% breakout on November 21, driving Bitcoin Cash price above $300 for the first time since September 2.
Bitcoin Cash price might be poised for a pullback
On the 12-hour chart, the TD Sequential indicator has presented a sell signal at the peak of $372. The last two calls had significant follow-through which adds strength to the current signal.
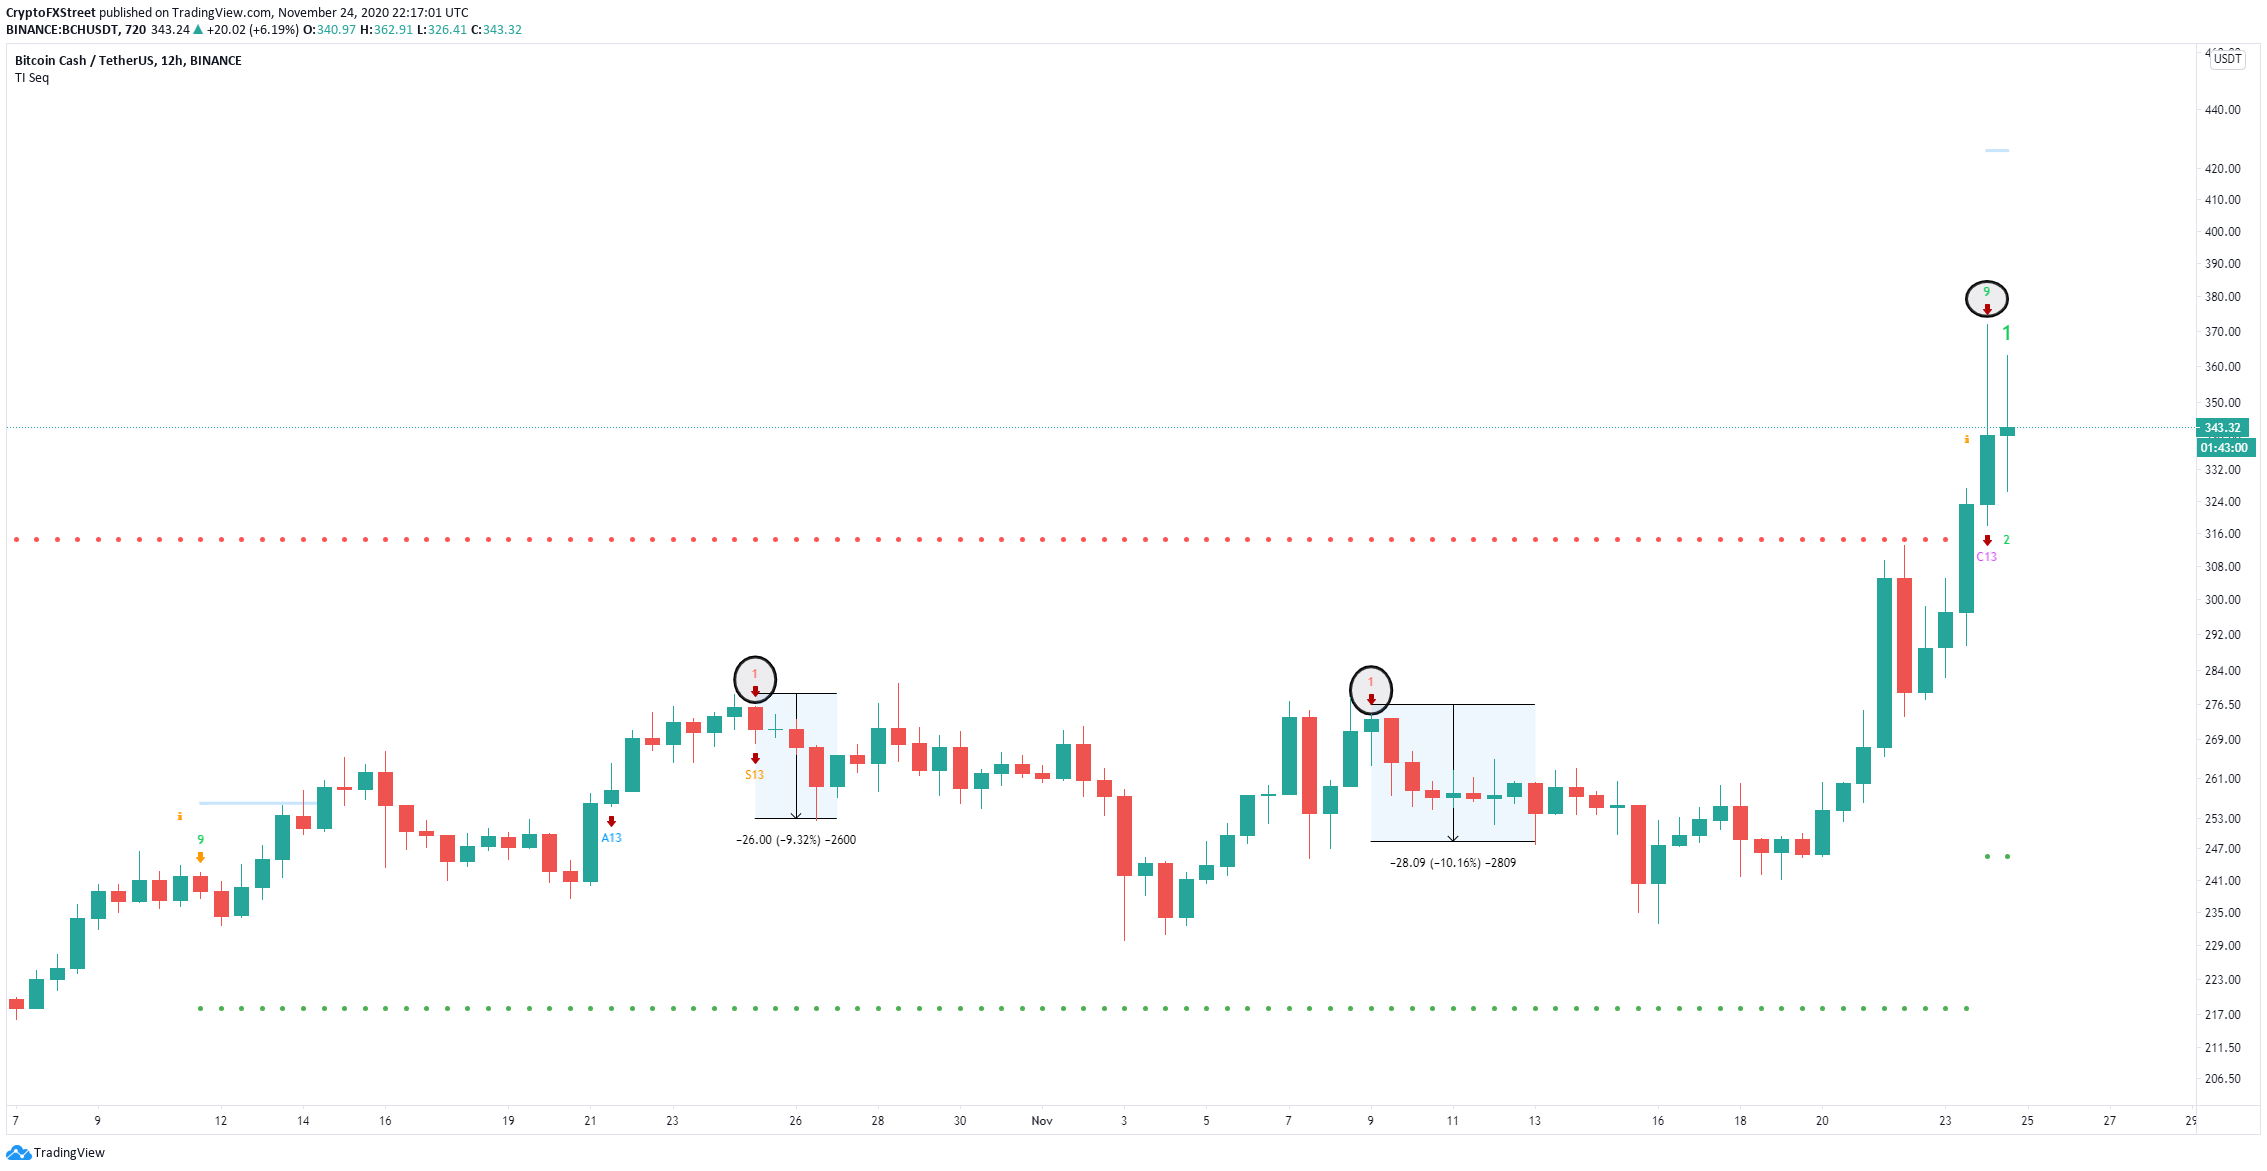
BCH/USD 12-hour chart
BCH’s confluence detector shows a significant support level at $339 which is the Pivot Point 1-day Resistance 1. Closer to the current Bitcoin Cash price of $343, there is another notable support level at $340 which coincides with the previous 4-hour low and the 100-SMA on the 15-minutes chart.
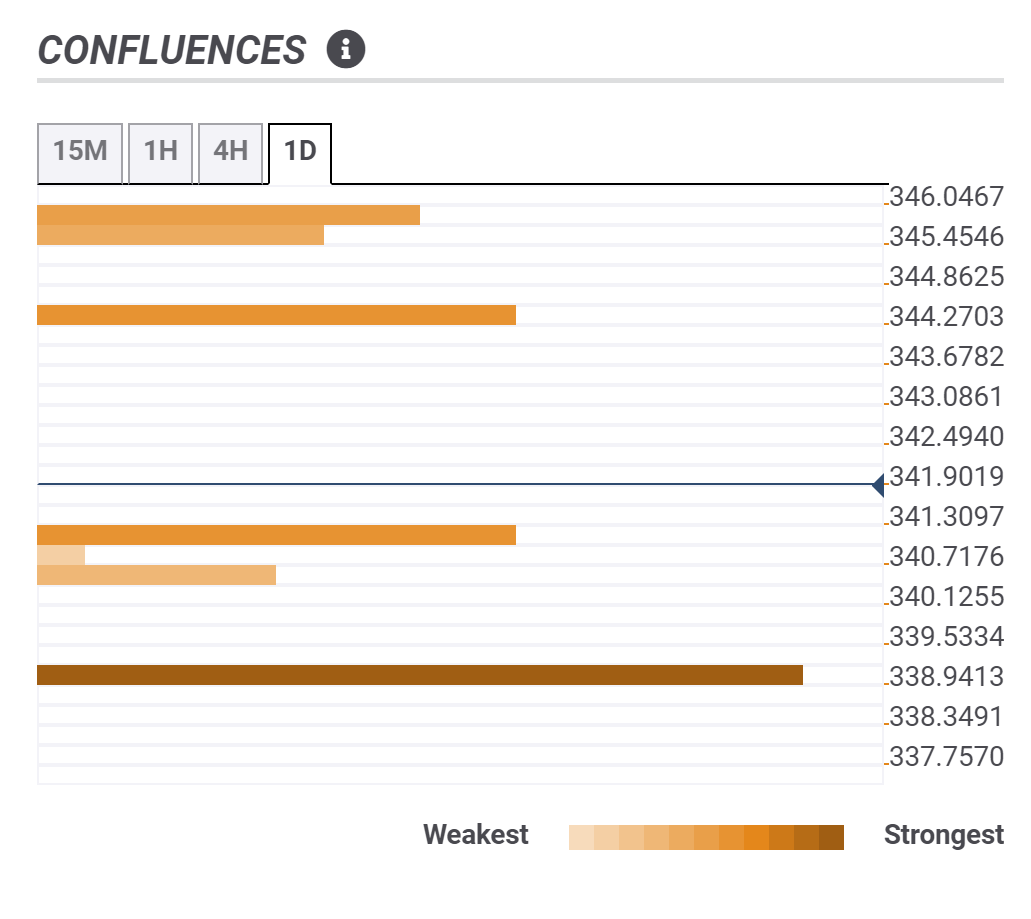
BCH Confluence levels
There seems to be less resistance on the way up with the most significant point at $344 where the 4-hour 5-SMA and the previous 15-minutes chart high are located. Additionally, the area between $345 and $346 also seems to offer some resistance. A breakout above this range could quickly drive Bitcoin Cash price towards $350.
