- Bitcoin Cash price is trading in the red, with losses of 4.05% in the second half of the session.
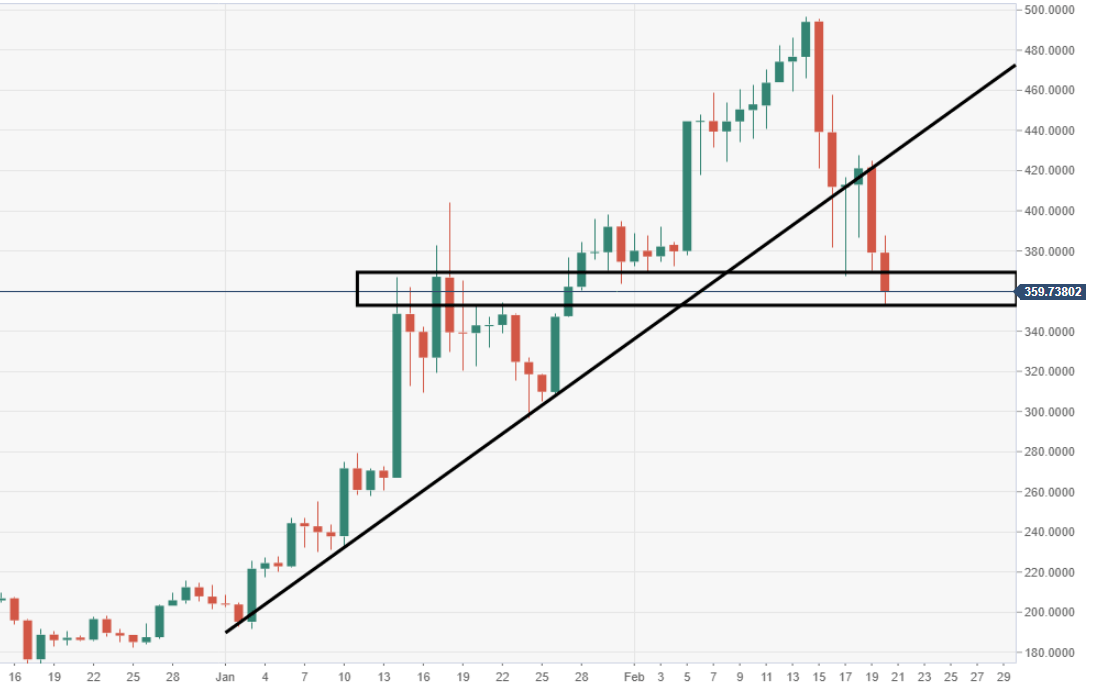
- BCH/USD is vulnerable following a key long-running ascending trend line breach.
- A critical daily area of demand can be seen tracking from $270-50.
BCH/USD daily chart
An ascending trend line has been supporting the price since the commencing of February, has now been broken. The price is running towards it second session in the red.
BCH/USD 60-minute chart
Price action has breached a bearish pennant structure via the 60-minute, inviting another wave of selling pressure.
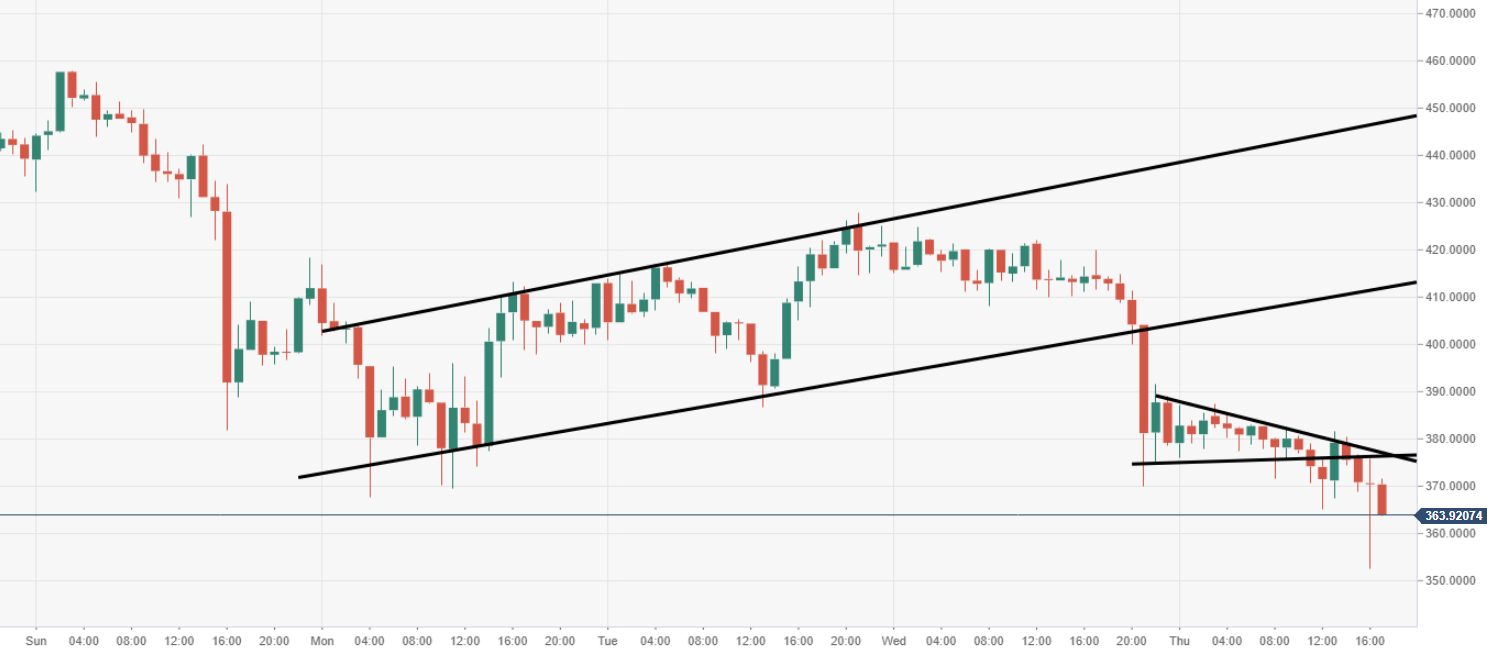
Spot rate: 363.92
Relative change: -4.05%
High: 387.50
Low: 352.64
