- BCH/USD went up from $312 to $339.65 this Monday.
- The SMA 50 has crossed over with the SMA 20, which is a bearish sign.
BCH/USD daily chart
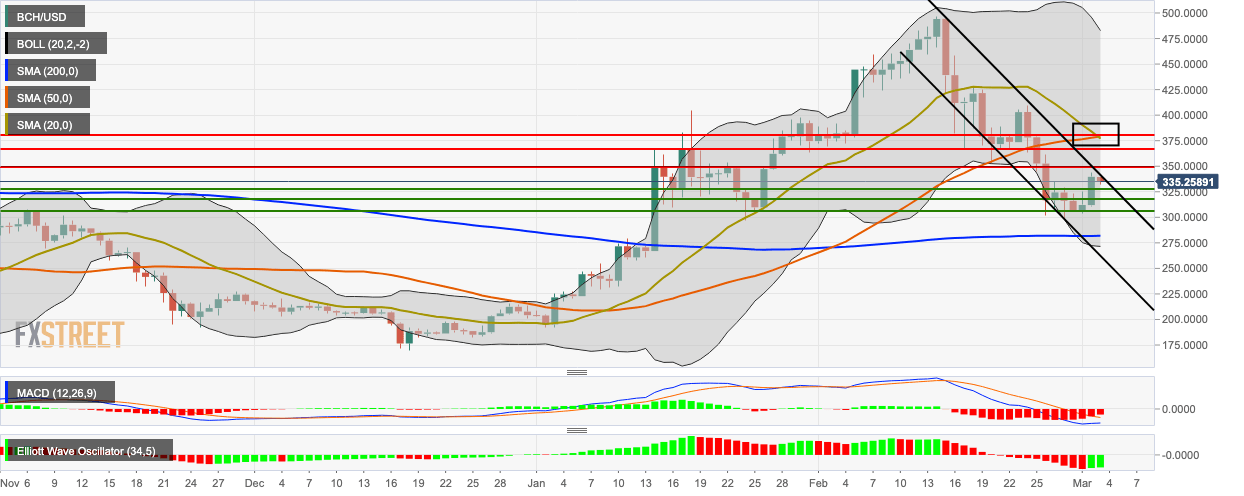
BCH/USD is trending in a downward channel formation, as the price lost steam near the $340-level. The bulls took the price up from $312 to $339.65 this Monday. The bears managed to take back control and dropped BCH/USD from $339.65 to $335 in the early hours of Tuesday. The price is hovering below the SMA 20 and SMA 50, with the latter crossing over the former, which is a bearish sign. The Elliott Oscillator has had two straight green sessions following 16 consecutive red sessions, while the MACD indicator shows decreasing bearish momentum.
