- Bitcoin Cash price is trading in the red, with losses of 7% in the second half of the session.
- BCH/USD is on course for its best weekly performance since May 2019.
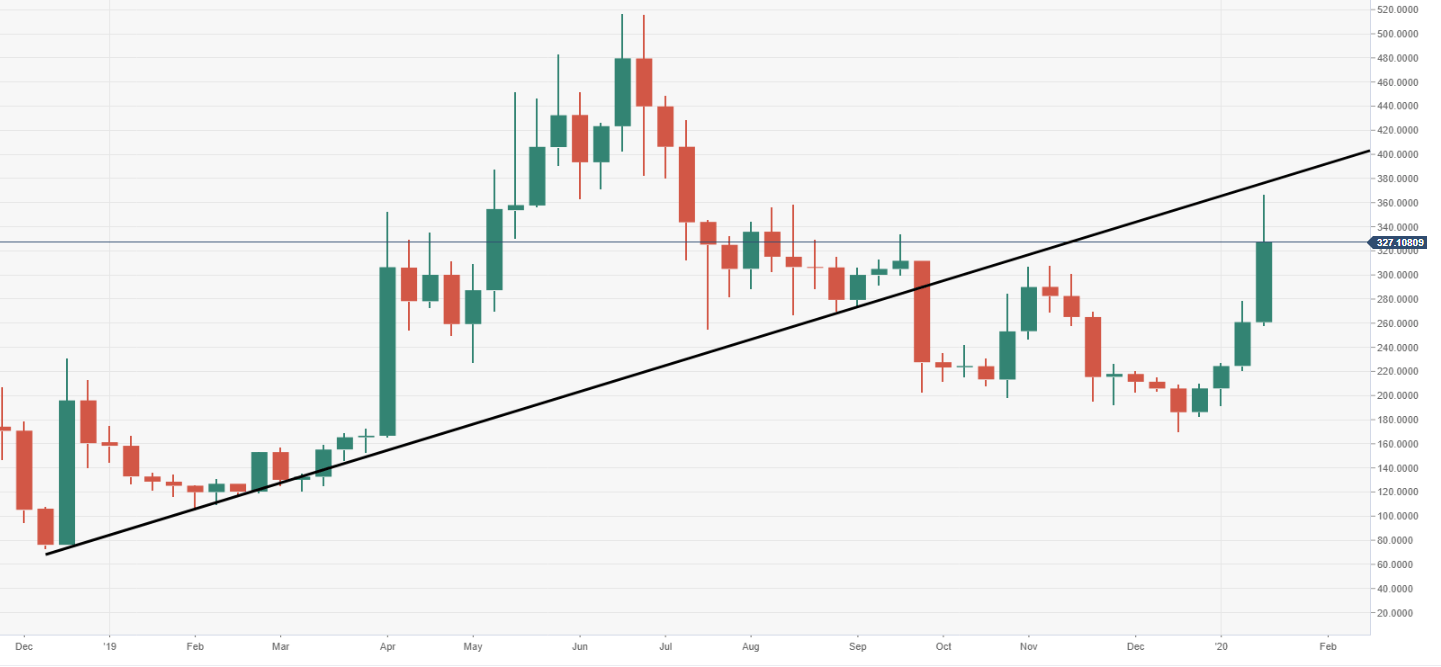
- The price is heading for a retest of a breached ascending trend line of former support.
BCH/USD weekly chart
The price is running at four consecutive weeks in the green, the best run north since May 2019.
BCH/USD daily chart
Bulls managed to smash through a descending trend line, which had capped price action since 7 July.
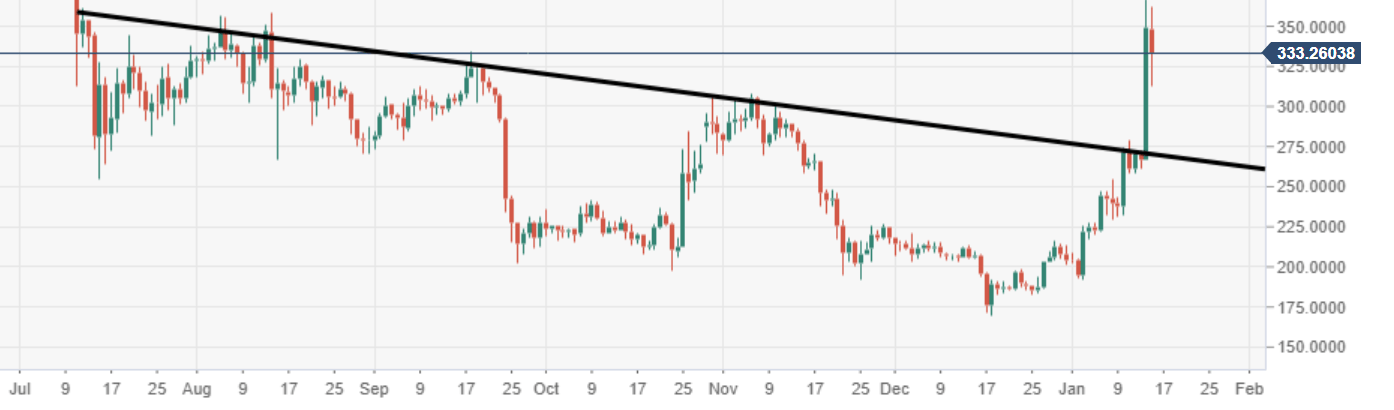
Spot rate: 333.25
Relative change: -4.50%
High: 361.75
Low: 266.99
