- This Friday, BCH/USD fell from $222 to $215.
- The MACD and Elliott Oscillator both indicate increasing bullish sentiment.
Key Levels
- Open: $214.7462
- High: $228.9033
- Low: $210.0277
- R3: $299.8949
- R2: $272.8492
- R1: $243.7857
- PP: $216.7400
- S1: $187.6764
- S2: $160.6308
- S3: $131.5672
BCH/USD daily chart
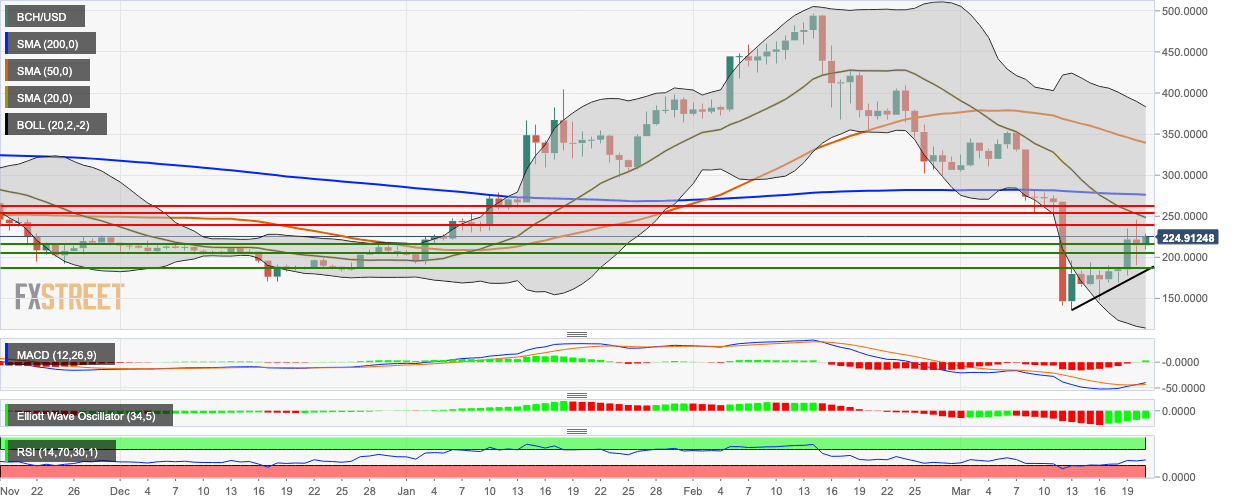
BCH/USD bulls took back control and brought the price up to $219.75, as they attempt to negate Friday’s bearish action wherein the asset from $222 to $215. The upward trending line is acting as immediate support as the price hovers below the SMA 20, SMA 50 and SMA 200 curves. The MACD indicates increasing bullish momentum, while the Elliott Oscillator has had five consecutive green sessions. The RSI indicator is trending horizontally around 42.10
