- Bitcoin Cash price is trading in the red, with losses of 0.85% in the second half of the session.
- BCH/USD has been testing a critical daily support range, $380-70.
- Given the pace of downside momentum, eyes are on a retet of the psychological $300 mark.
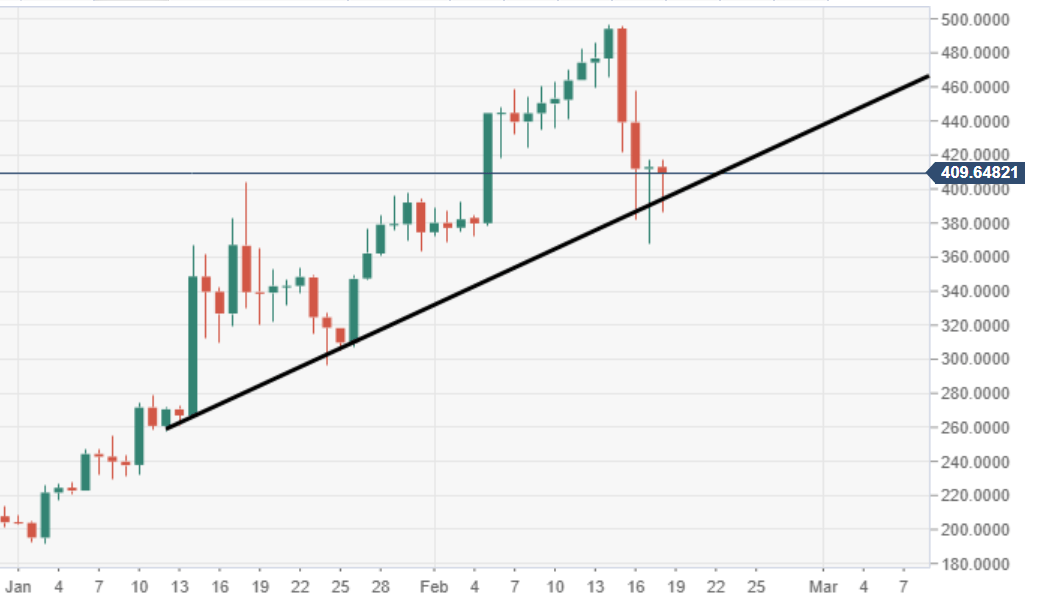
BCH/USD daily chart
The price is running towards its fourth potential session in the red, as the bears maintain downside pressure.
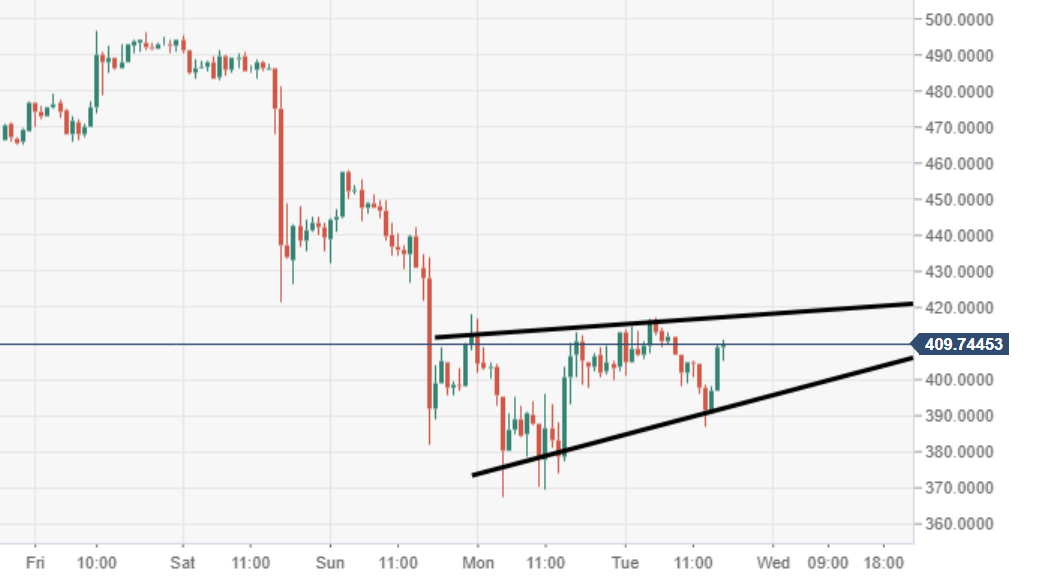
BCH/USD 60-minute chart
Price action is moving within a bearish flag/pennant structure via the 60-minute chart.
Spot rate: 404.15
Relative change: -0.85%
High: 417.33
Low: 386.72
