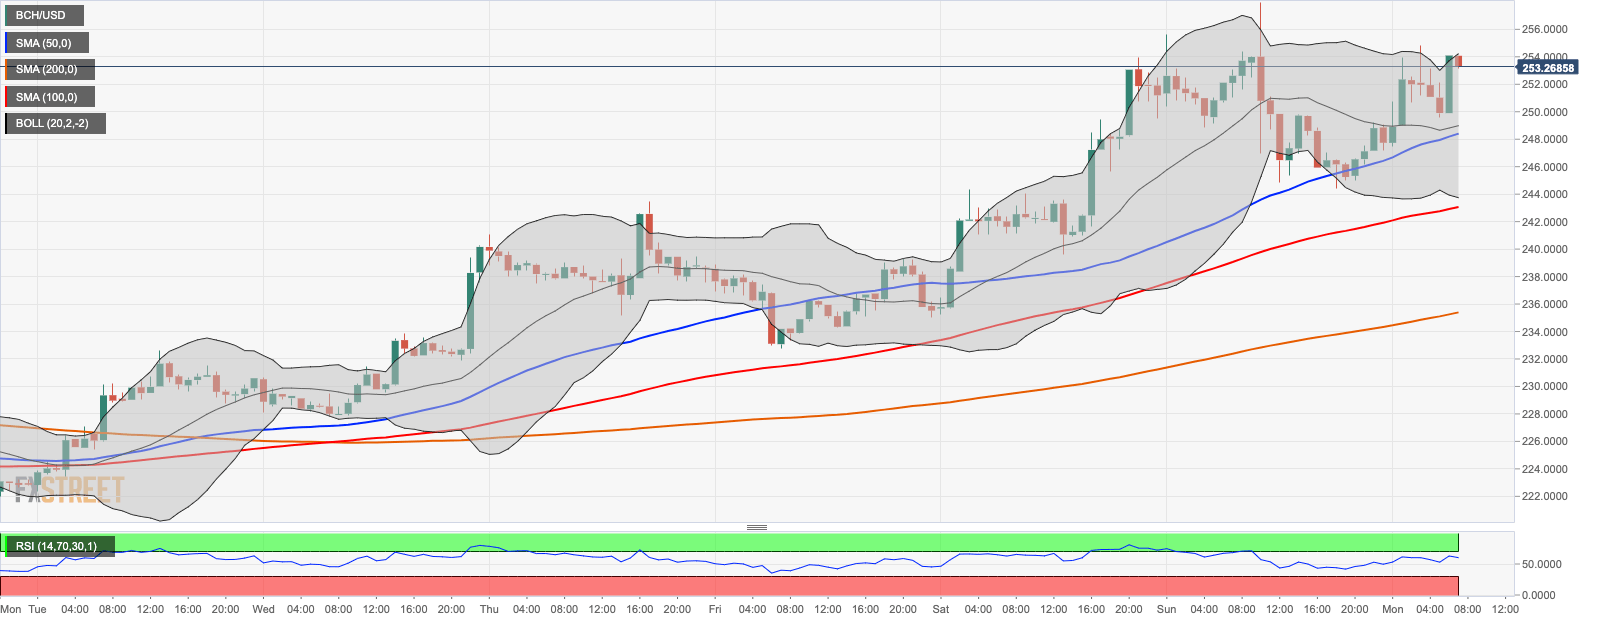
- Bitcoin Cash (BCH) recovery is capped by the upper line of the 1-hour Bollinger Band above $254.00.
- The intraday RSI implies that the coin is vulnerable to the downside correction.
Bitcoin Cash (BCH) rallied from $249 to $254 in a matter of minutes on Monday. While the coin stays below the recent high touched at $257.99 on Sunday, it is still moving within a strong bullish trend in sync with the rest of the market. At the time of writing, BCH/USD is changing hands at $253.25, having gained 2.6% since the beginning of the day and mostly unchanged in the recent 24 hours.
BCH is the fifth-largest digital asset with the current market value of $4.66 billion and an average daily trading volume of $1.84 billion.
BCH/USD: Technical picture
On the intraday charts, BCH/USD recovery is capped by the upper line of the 1-hour Bollinger Band at $254.25. This local barrier may slow down the upside move of the coin, but once it is out of the way, the next resistance of $258.00 and $260.00 will come into focus. This area includes the weekend high and the psychological barrier, which means, the bulls might have need some time to push to 200-day SMA at $273. The price has been moving below this MA since March 9, and tried to break it on several occasions, which makes it a strong hurdle on the way to $300.00.
On the downside, the middle line of the 1-hour Bollinger Band at $249.00 serves as local support. It is closely followed by a 50-hour SMA at $248.50. If the price moves below this barrier, the sell-off may be extended towards 100-hour SMA at $243.00 and psychological $240.00. The critical short-term support is created by 200-hour SMA and 50-day SMA at $235.40. Considering the downward-looking RSI on the 1-hour chart, the short-term correction looks likely; however, the recovery is on track as long as the price stays above $235.00
BCH/USD 1-hour chart