- BCH/USD is currently priced at $315.25.
- The price is still clinging on to the upper Bollinger Band curve.
Following four straight bullish days, Bitcoin Cash bears are on course of charting a second straight bearish day. BCH/USD is currently priced at $315.25. The market had previously gotten rejected at the $325.60 line and fallen down. BCH/USD has found support at the 200-day Simple Moving Average (SMA 200), SMA 50 and SMA 20 curves.
BCH/USD daily chart
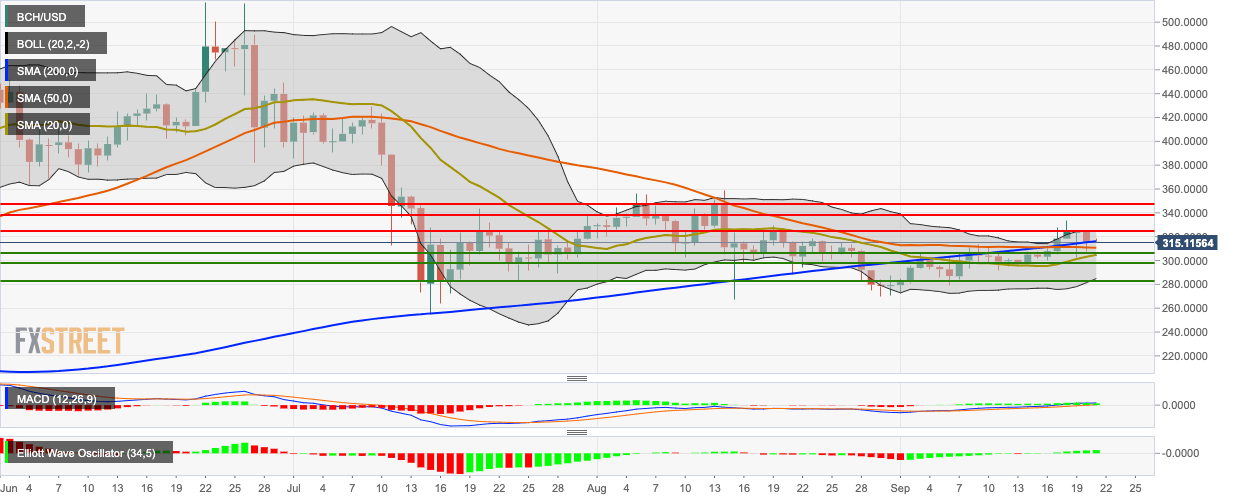
The daily chart is still flirting with the upper curve of the 20-day Bollinger Band. The two straight bearish days have brought the price back inside the band. The Moving Average Convergence/Divergence (MACD) indicator shows sustained bullish momentum, while the Elliott Oscillator shows eight straight bullish sessions.
