Bitcoin Cash price trades above the $500 psychological level for the 3rd day running as bulls focus on areas beyond the $600 mark. The upward trajectory was most significant on Monday when BCH gained more than 15% in the first half of the day. Following this rally, Bitcoin Cash stepped the $500 psychological level as 20-day Simple Moving Average (SMA) flipped from resistance to support.
On Tuesday, BCH opened the day below $500 and traded in the greed the whole day to close at around $503. At the time of writing, BCH price remains hands as it exchanges hands at $512, having reached a high of $518 earlier today.
Bitcoin Cash Sits on Strong Support
Bitcoin Cash price flashed a buy crypto signal earlier today on the four-hour chart when the Moving Average Convergence Divergence (MACD) indicator crossed above the signal line. The trend-following indicator sent a signal for traders to buy the asset showing that buyers are still in control of BCH.
The movement of the MACD above the zero line into the positive region will add validate the bullish outlook indicating that the bullish momentum is unstoppable.
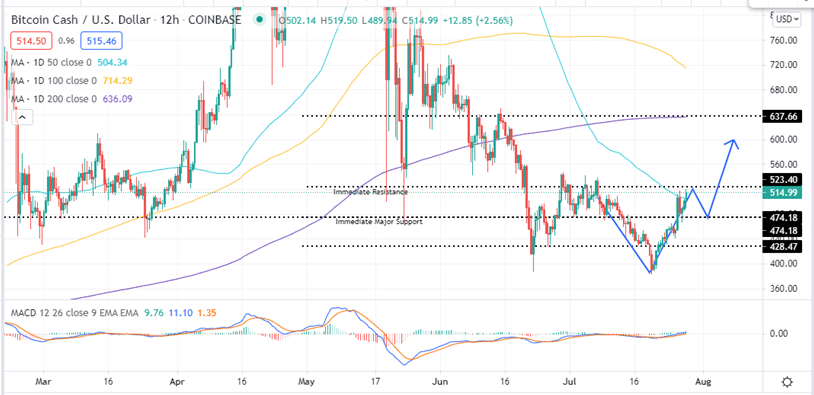
From the 12-hour chart, BCH seems to be sitting on strong support downwards. For example, Bitcoin Cash has just flipped the 50-day SMA from resistance to support at $504. Even if the asset goes below this level, the immediate support at $474 is a major anchor zone that can prevent the price from slipping back to the July 20 low at around $383.
Bitcoin Cash Price 12-Hour Chart
On-chain metrics from the “In/Out of the Money Around Price” (IOMAP) model by IntoTheBlocks validates that Bitcoin Cash is currently sitting on a strong support. Based on this indicator, there is significant support between the $501 and $514 range filled by approximately 307,000 addresses who previously bought roughly 307,000 BCH. Note that the BCH’s immediate support coinciding with the 50-day SMA at $504 is within this range and must be defended to sustain the bullish momentum.
Even if this support zone doesn’t hold, the next support zone between $484 and $501 may be robust enough to counter any selling pressure.
Bitcoin Cash IOMAP Chart
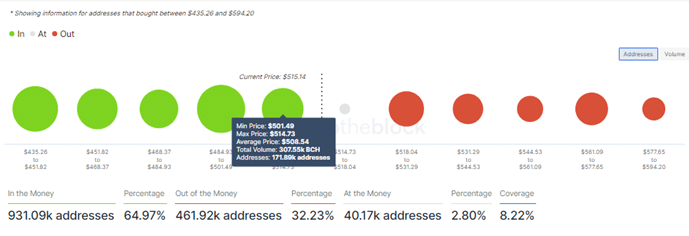
On the flip side, the same IOMAP model shows that there is no significant barrier that curtail BTC’s upward surge. According to the metrics, there is minor resistance between $518 and $531 where about 268,000 investors previously purchased around 124,000 BCH. These may have the ability to absorb some buying pressure as some sellers could seek to break-even at this range.
- Are you new to crypto trading? This guide on best cryptocurrency to buy may be useful.
BCH Could Reach These Levels?
If bulls are able to slice through the resistance level at $523, Bitcoin Cash is likely to climb to the $600 psychological level and beyond.
Looking to buy or trade Bitcoin Cash now? Invest at eToro!
Capital at risk
