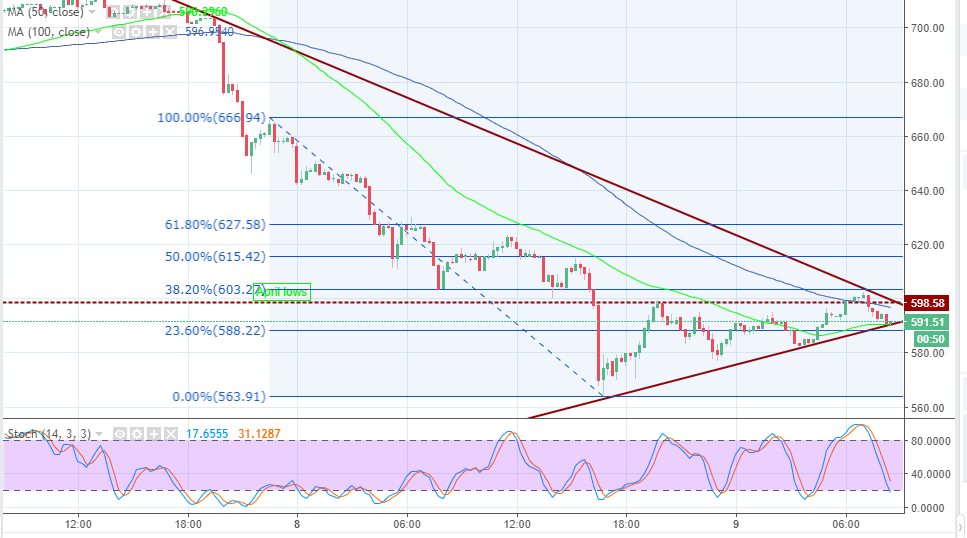
- In spite of this slight recovery, BCH/USD is still trading below April lows.
- Bitcoin price is also trading between the moving average support and resistance on the 15-minutes chart.
- The 23.6% Fibo level is the critical support in the short-term.
Bitcoin Cash decline on Wednesday 8 to record lows of $ 575.64. The former support at $580 did little to stop the sharp drop, however, BCH/USD bounced back past the 23.6% Fib level resistance at $588.28. In spite of this slight recovery, the crypto is still trading below April lows ($598.58).
The price is currently trading between the simple moving average support and resistance. The 50 SMA is providing support at $590.50 while the 100 SMA is in the way of recoil at $597.15. Similarly, the upside is locked within the confines of a contracting triangle. A breakout is in the pipeline, but the bulls must hold the trendline support at the 50 SMA. The 23.6% Fibo level is the critical support in the short-term. BCH/USD must not be allowed to drop below this level otherwise another break down could explore new August lows towards $500.
After the overarching declines, the only way seems to be up for Bitcoin Cash bulls. But they must break out of the contracting triangle and seek a support above $600.The 38.2% Fib retracement level with last swing high of $666.94 and a swing low of $563.91 will prevent movement to the upside, although the critical resistance is positioned at $620.
BCH/USD 15′ chart