- Recovery from mid-July lows has been impeccably bullish forming a higher low pattern.
- The prevailing technical picture suggests that the next support $330 is at risk.
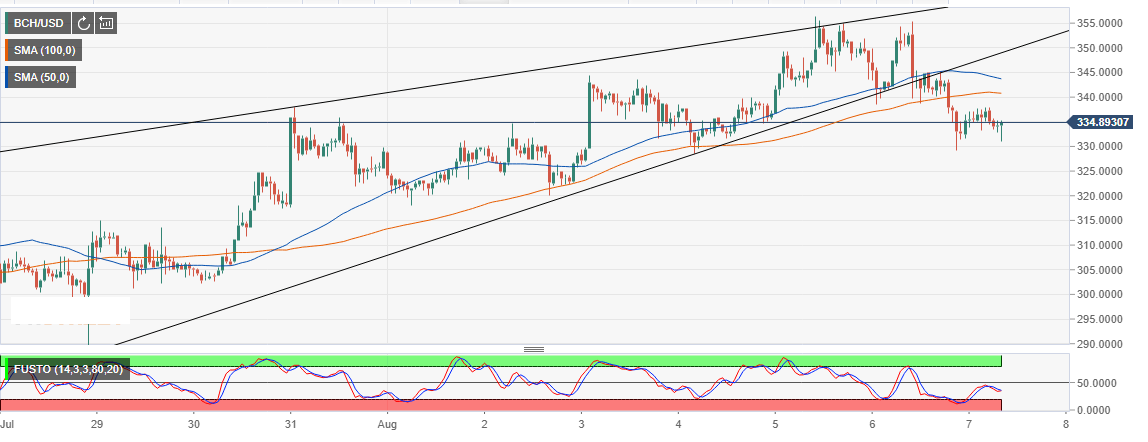
Bitcoin Cash made a swing on levels at $355 on August 5 and August 6. However, diminishing buying power saw up leg cut short. Recovery from mid-July lows has been impeccably bullish forming a higher low pattern within a rising wedge pattern.
BCH/USD first corrected above both the 50 Simple Moving Average 1-hour chart and the 100 SMA 1-hour on July 30. The move reignited the bullish momentum allowing the bulls to cement their position above $300. The lock-step trading in the first week of August is seen to have an affinity to for upper levels.
Unfortunately, the reaction to rising wedge pattern, which generally a reversal pattern, has seen the price correct from the highs achieved around $355. Bitcoin Cash is currently trading below the moving averages. The bearish leg has extended under $340 broken support. The prevailing technical picture suggests that the next support $330 is at risk. For instance, the full stochastic oscillator is heading south after failing to rise above 50. If this downward trend continues, we are likely to see, Bitcoin Cash exodus to $300.
BCH/USD 1-hour chart