- The price has managed to bounce up from the 50-day SMA.
- Bulls face strong resistance at 100-day SMA and 200-day SMA.
Bitcoin Cash fell from $268.25 to $241.70 in three days between November 2 and November 4. In the process, it broke below the 100-day SMA and 200-day SMA. However, a critical support wall has remained strong, which could swing the fortunes in the bulls’ favor.
The 50-day SMA holds strong
The buyers have bounced BCH up to $245 after bouncing up from the 50-day SMA. Looking at the price history, the 50-day SMA has been a solid support and resistance level. Following this bullish price action, the relative strength index (RSI) has stopped its downward movement and swung up from 41.60 to 43.45.
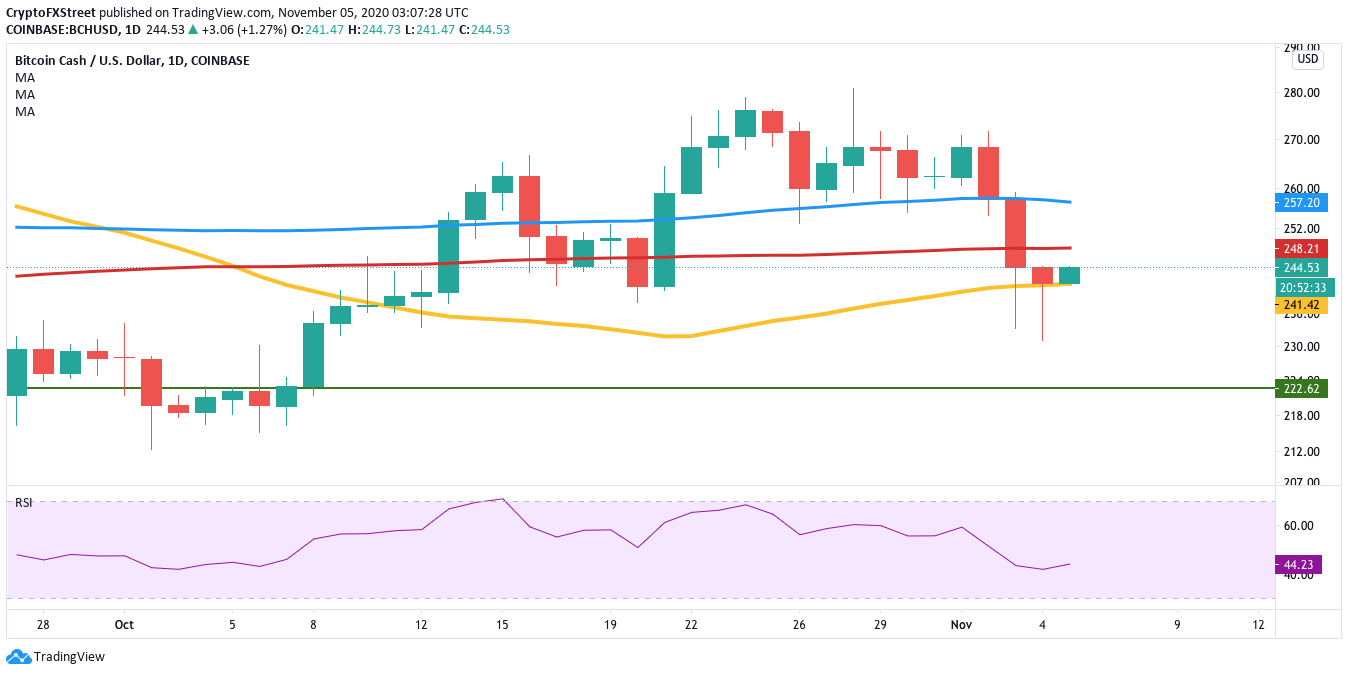
BCH/USD daily chart
The daily confluence detector helps us visualize healthy levels of support and resistance. As per the detector, we have two strong resistance levels at the 100-day SMA ($257) and 200-day SMA ($248). Upon breaking above these barriers, the price will be able to break into the $275-zone.
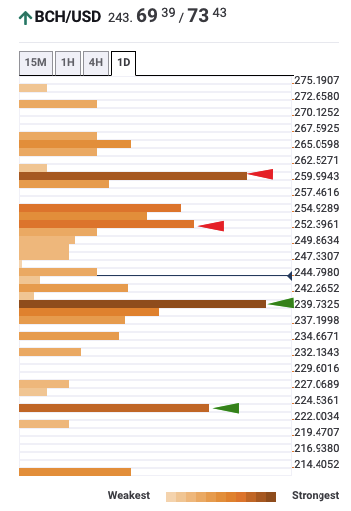
BCH daily confluence detector
The bullish thesis holds when looking at Santiment’s holders distribution chart. The number of addresses holding 1,000-10,000 tokens went up from 1,724 on November 1 to 1,755 at the time of writing. Similarly, the number of addresses holding 10,000-1 million tokens rose from 170 on November 2 to 171 at the time of writing.
%20%5B08.59.54,%2005%20Nov,%202020%5D-637401452496924379.png)
BCH holders distribution
It should be noted that this thesis holds only if the 50-day SMA doesn’t crumble. If the bears manage to take BCH down, the next viable support wall, as per the daily confluence detector, is at $222.50.
