- Bitcoin Cash price is trading in the green, with gains 0.95% in the second half of the session.
- BCH/USD is at risk of testing the critical $200 mark to the downside.
- The next major area of support should be then noted at March lows, $140.
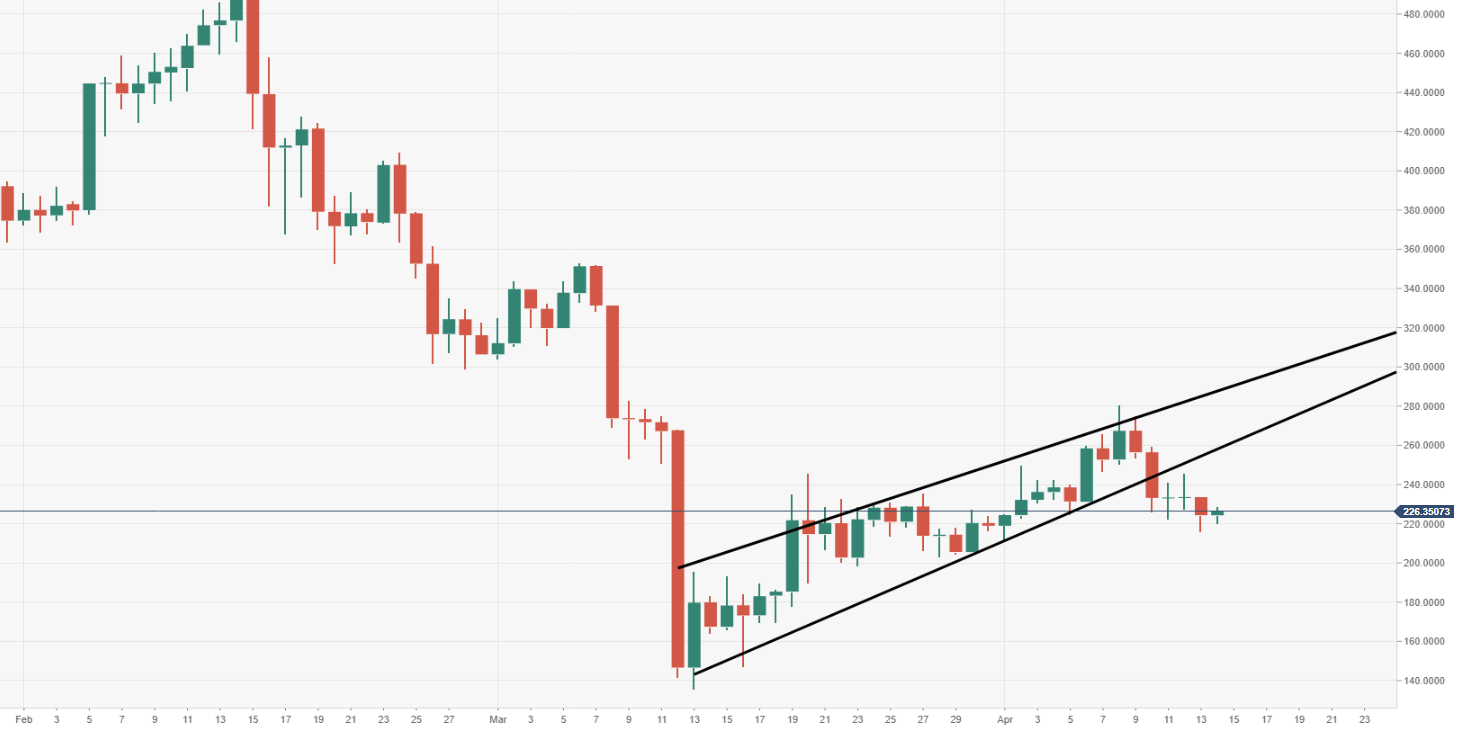
BCH/USD daily chart
Price action formed a bearish flag from 13 March up until 8 April, of which the bears forced a breach.
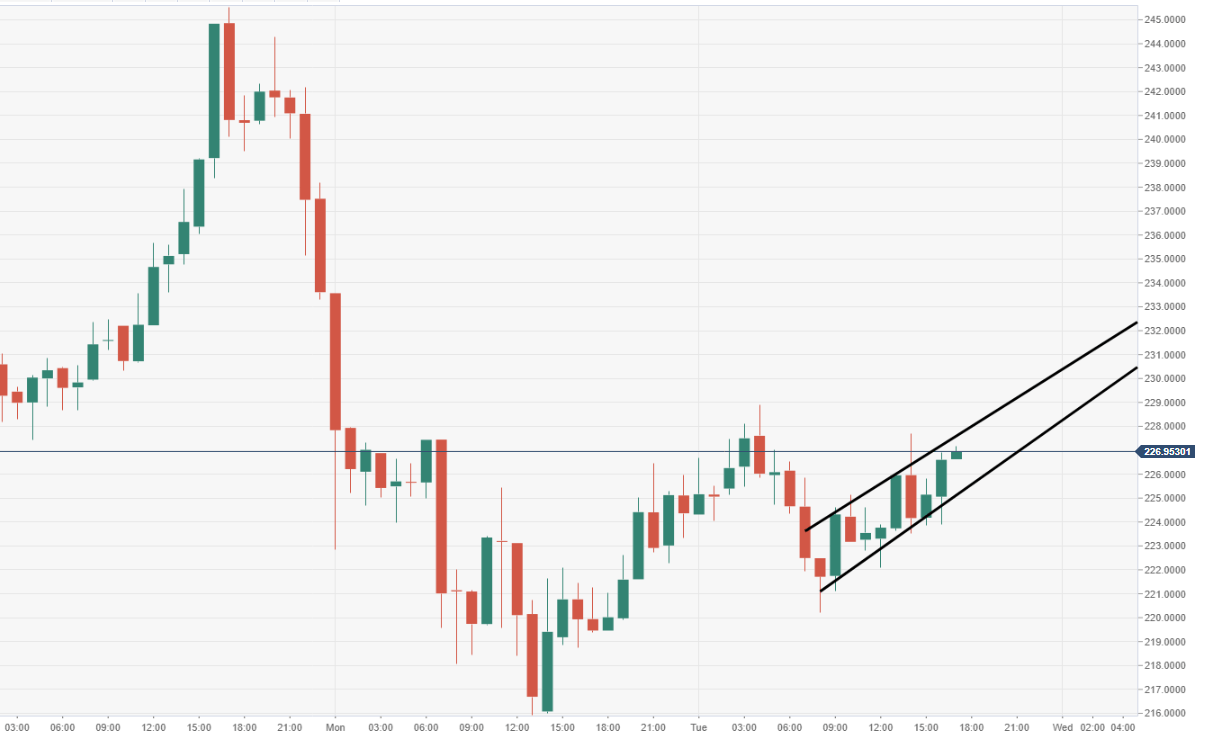
BCH/USD 60-minute chart
In addition to the bearish daily view, a flag breakout can also be observed via the 60-minute.
Spot rate: 220.97
Relative change: +0.95%
High: 228.89
Low: 220.21
