- The world’s 5th most favorite cryptocurrency is down 20+% on the week.
- Range play intact, as bears await fresh impetus for the next leg lower.
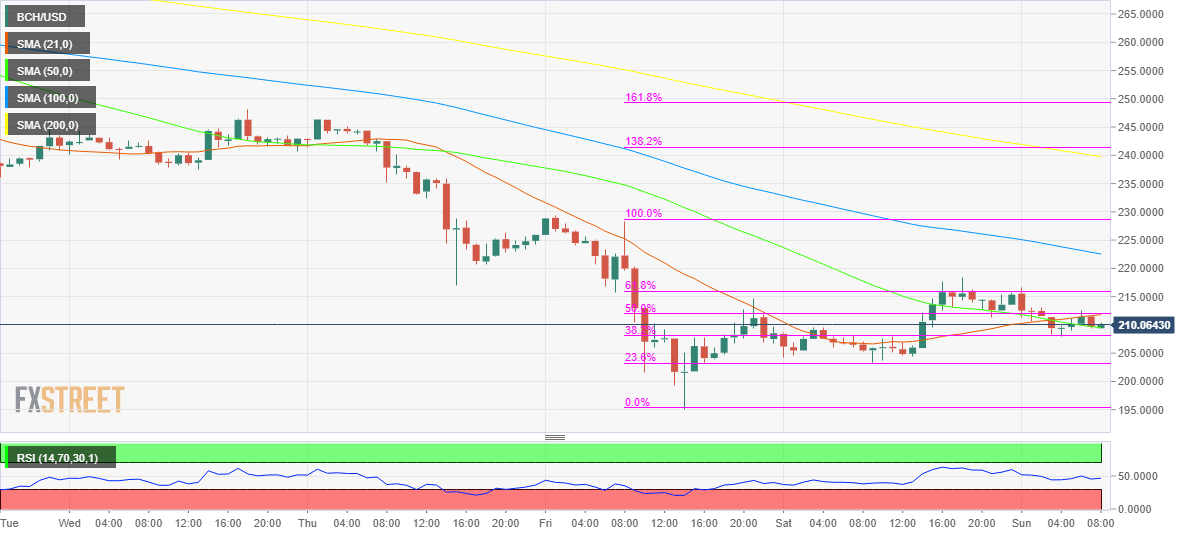
The recovery from seven-month lows of 195.13 lost legs on Saturday near 218.50, as Bitcoin Cash (BCH/USD), currently trades around the 210 level, in absence of the weekend love this Sunday. The coin trades around a flat line, having hit a daily high of 216.70 and a daily low of 207.88. With the latest decline, the price trades 2+% lower on a daily basis while rising 3% over the last 24 hours. The market capitalization for BCH stands at $ 3.85 billion.
BCH/USD 1-hour chart
As observed on the hourly sticks, the price failed once again to take out the 61.8% Fibonacci Retracement level of Friday’s decline, placed near the 216.10 region on Sunday. Since then, the sellers are in charge, having driven the coin back below the 50% Fib level at 212.10. The No. 5 coin continues to trade in a tight range over the last hours, stuck between the now 50% Fib resistance and 38.2% Fib support around 208.00. The upward-sloping 21-hourly Simple Moving Average (HMA) near 212 region continues to restrict the price-action while the hourly Relative Strength Index (RSI) trades flatlined right at the 50 level. This suggests neutral bias in the near-term. However, with heavy-looking crypto markets, the bearish pressure on the coin will remain intact going forward.
Any recovery is likely to be limited by the 61.8% Fib level. However, if the bulls are successful to regain the last, they are likely to extend the break higher towards the downward sloping 100-HMA, located at 222.55.
BCH/USD Levels to watch
