- Bitcoin Cash is potentially poised for a correction above $300 in the coming sessions.
- A move past $300 will place BCH/USD in an upward trajectory above $320 key hurdle.
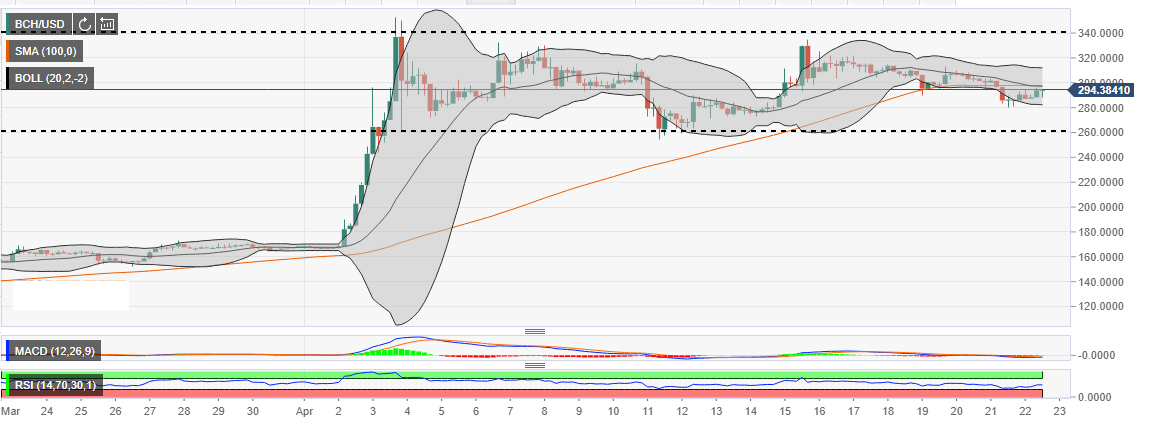
The 4-hour chart shows Bitcoin Cash trending sideways within a long-term range between $340 (range resistance) and $260 (range support). Following the drop on April 21, the price has not been able to recover above $300. Besides, the price currently stuck in the Bollinger Band 4-hour lower curve.
The formation of a doji candlestick shows that the market in the state of indecision at $293. Technical indicators applied to the chart show that Bitcoin Cash is potentially poised for a recovery above $300. The Relative Strength Index (RSI) in the same 4-hour range 46.15 has recovered from the levels close to 30.00 (Sunday levels). The signal from the indicator is neither negative nor positive confirming the indecision. Moreover, the moving average convergence divergence (MACD) is stuck below the mean line (0.000) in addition to being horizontal at -3.3173.
If Bitcoin Cash makes a significant move below the Bollinger Band, it to break down to the levels below $280. Further breakdown is likely to test $260 range support. Meanwhile, a move past $300 will place BCH/USD in an upward trajectory above $320 (key hurdle) in preparation to assault $340 (critical resistance).
BCH/USD 4-hour chart