- Bitcoin price is trading down some 11% in the second half of the session on Thursday.
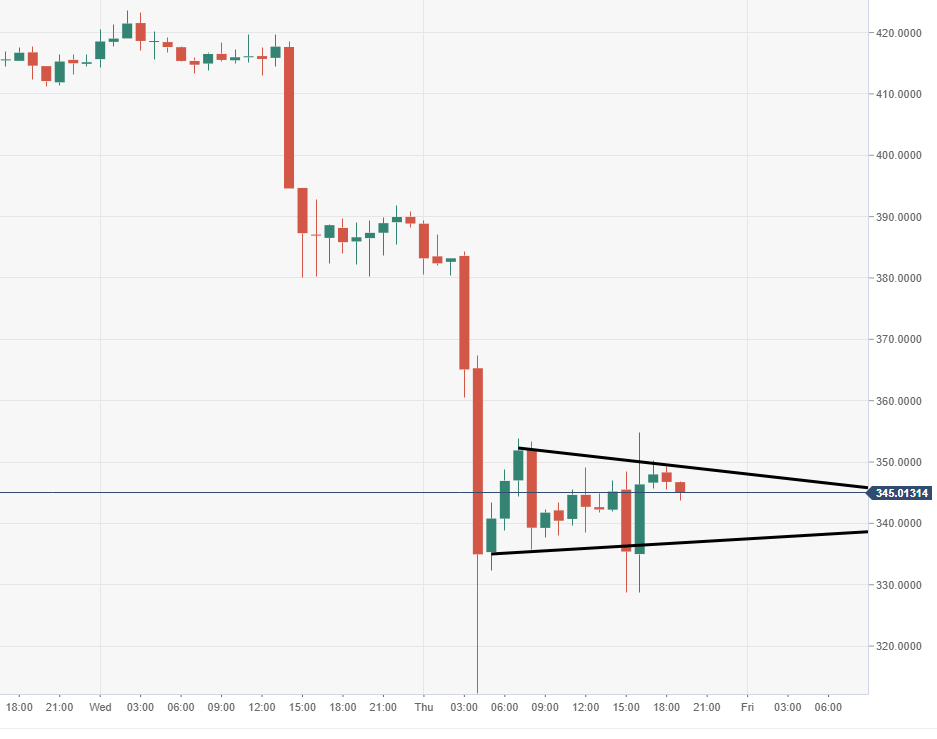
- BCH/USD price action via the 60-minute chart view is moving within a bearish pennant structure.
- Next major demand zone to the downside eyed at around $230, should the bears manage to further press south.
Spot rate: 345.62
Relative change: -11.10%
High: 389.33
Low: 312.34
BCH/USD 60-minute chart
- 60-minute price action is moving within a bearish pennant formation, subject to a breakout.
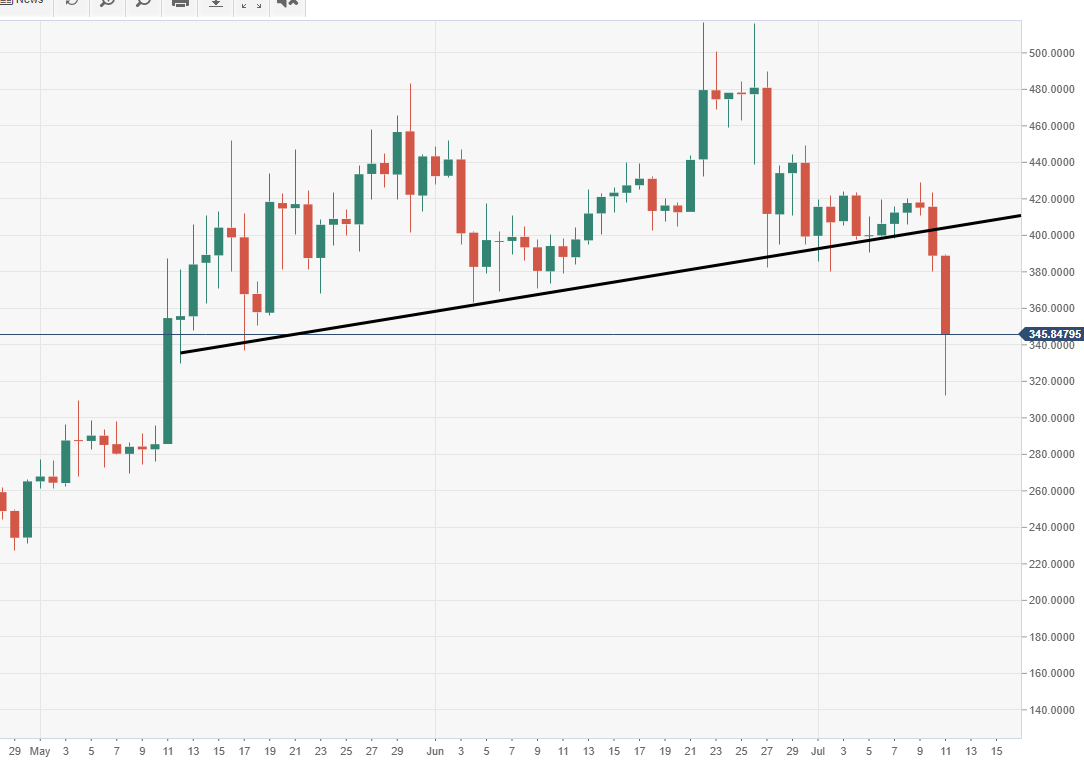
BCH/USD daily chart
- An extension to the downside was seen following a key daily trend line failing to hold the price.