Home Bitcoin Cash Technical Analysis: BCH/USD breaks out of triangular pattern, sellers forcing their way through, retest underneath and continued selling eyed
Crypto News

Bitcoin Cash Technical Analysis: BCH/USD breaks out of triangular pattern, sellers forcing their way through, retest underneath and continued selling eyed

  • Bitcoin Cash drops over 5% on Tuesday, as mass selling across the crypto market is observed.
  • BCH/USD breaks out to the downside from a triangular pattern seen on the 60-minute chart.


BCH/USD 60-minute chart
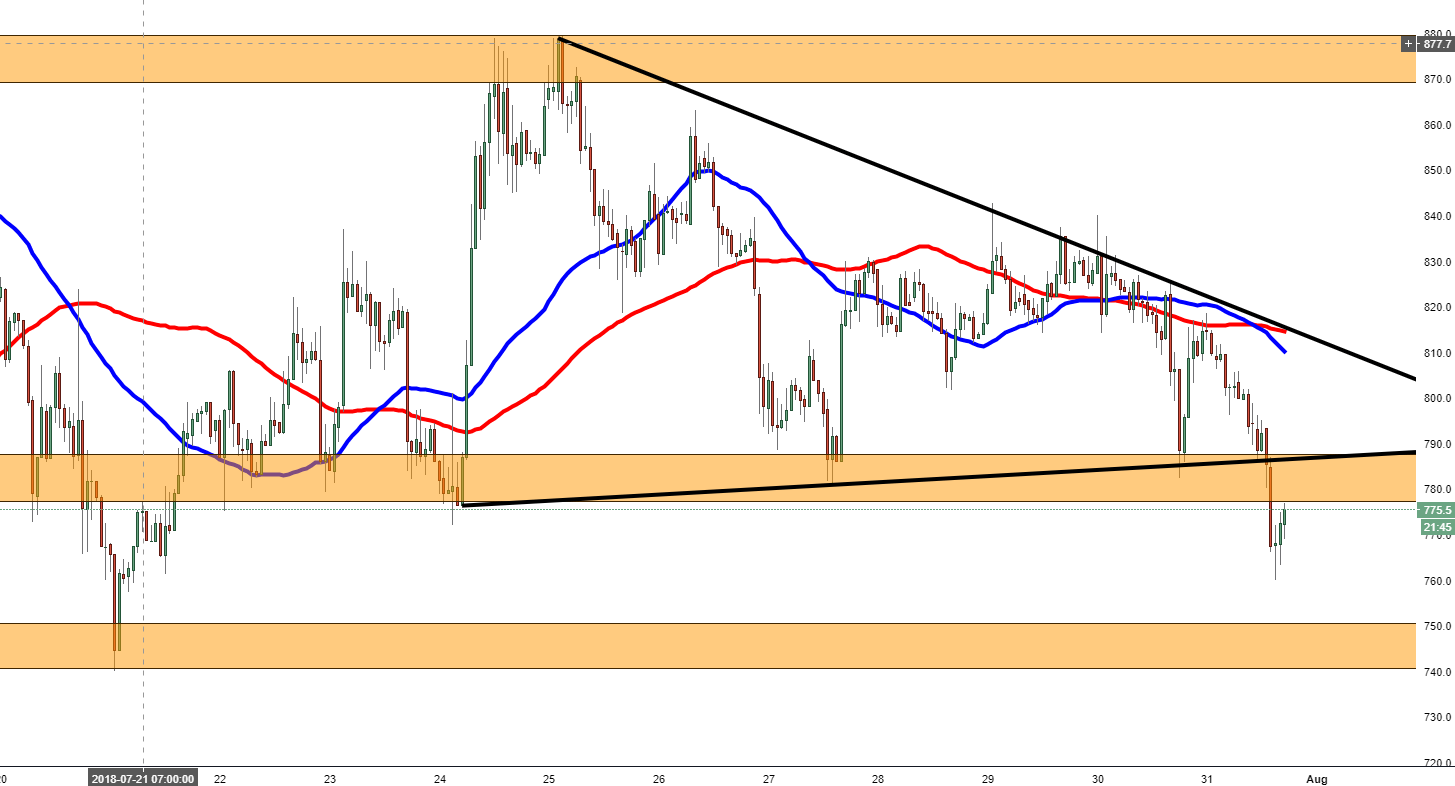


Spot rate:                    775.2

Relative change:        -4.83%

High:                           814.9

Low:                            760.0

Trend:                         Bearish


Support 1:                 760.0 today’s (Tuesday) &  (support on 60-minute chart).  

Support 2:                 750.5, demand zone.

Support 3:                  740.2, 21st July.

Resistance 1:            780.0, supply zone.

Resistance 2:            786.2, underneath triangular pattern.

Resistance 3:            810.0, 50MA.


FX Street

FX Street

FXStreet is the leading independent portal dedicated to the Foreign Exchange (Forex) market. It was launched in 2000 and the portal has always been proud of their unyielding commitment to provide objective and unbiased information, to enable their users to take better and more confident decisions.