Home Bitcoin Cash Technical Analysis: BCH/USD breaks out to the downside from an ascending wedge, bears looking to take advantage
Crypto News

Bitcoin Cash Technical Analysis: BCH/USD breaks out to the downside from an ascending wedge, bears looking to take advantage

  • Bitcoin Cash price was seen down some 2.50%  on Thursday, as bulls start to lose momentum after solid start to the week.
  • BCH/USD bears have broken a rising wedge pattern observed on the 60-minute chart.


BCH/USD 60-minute chart
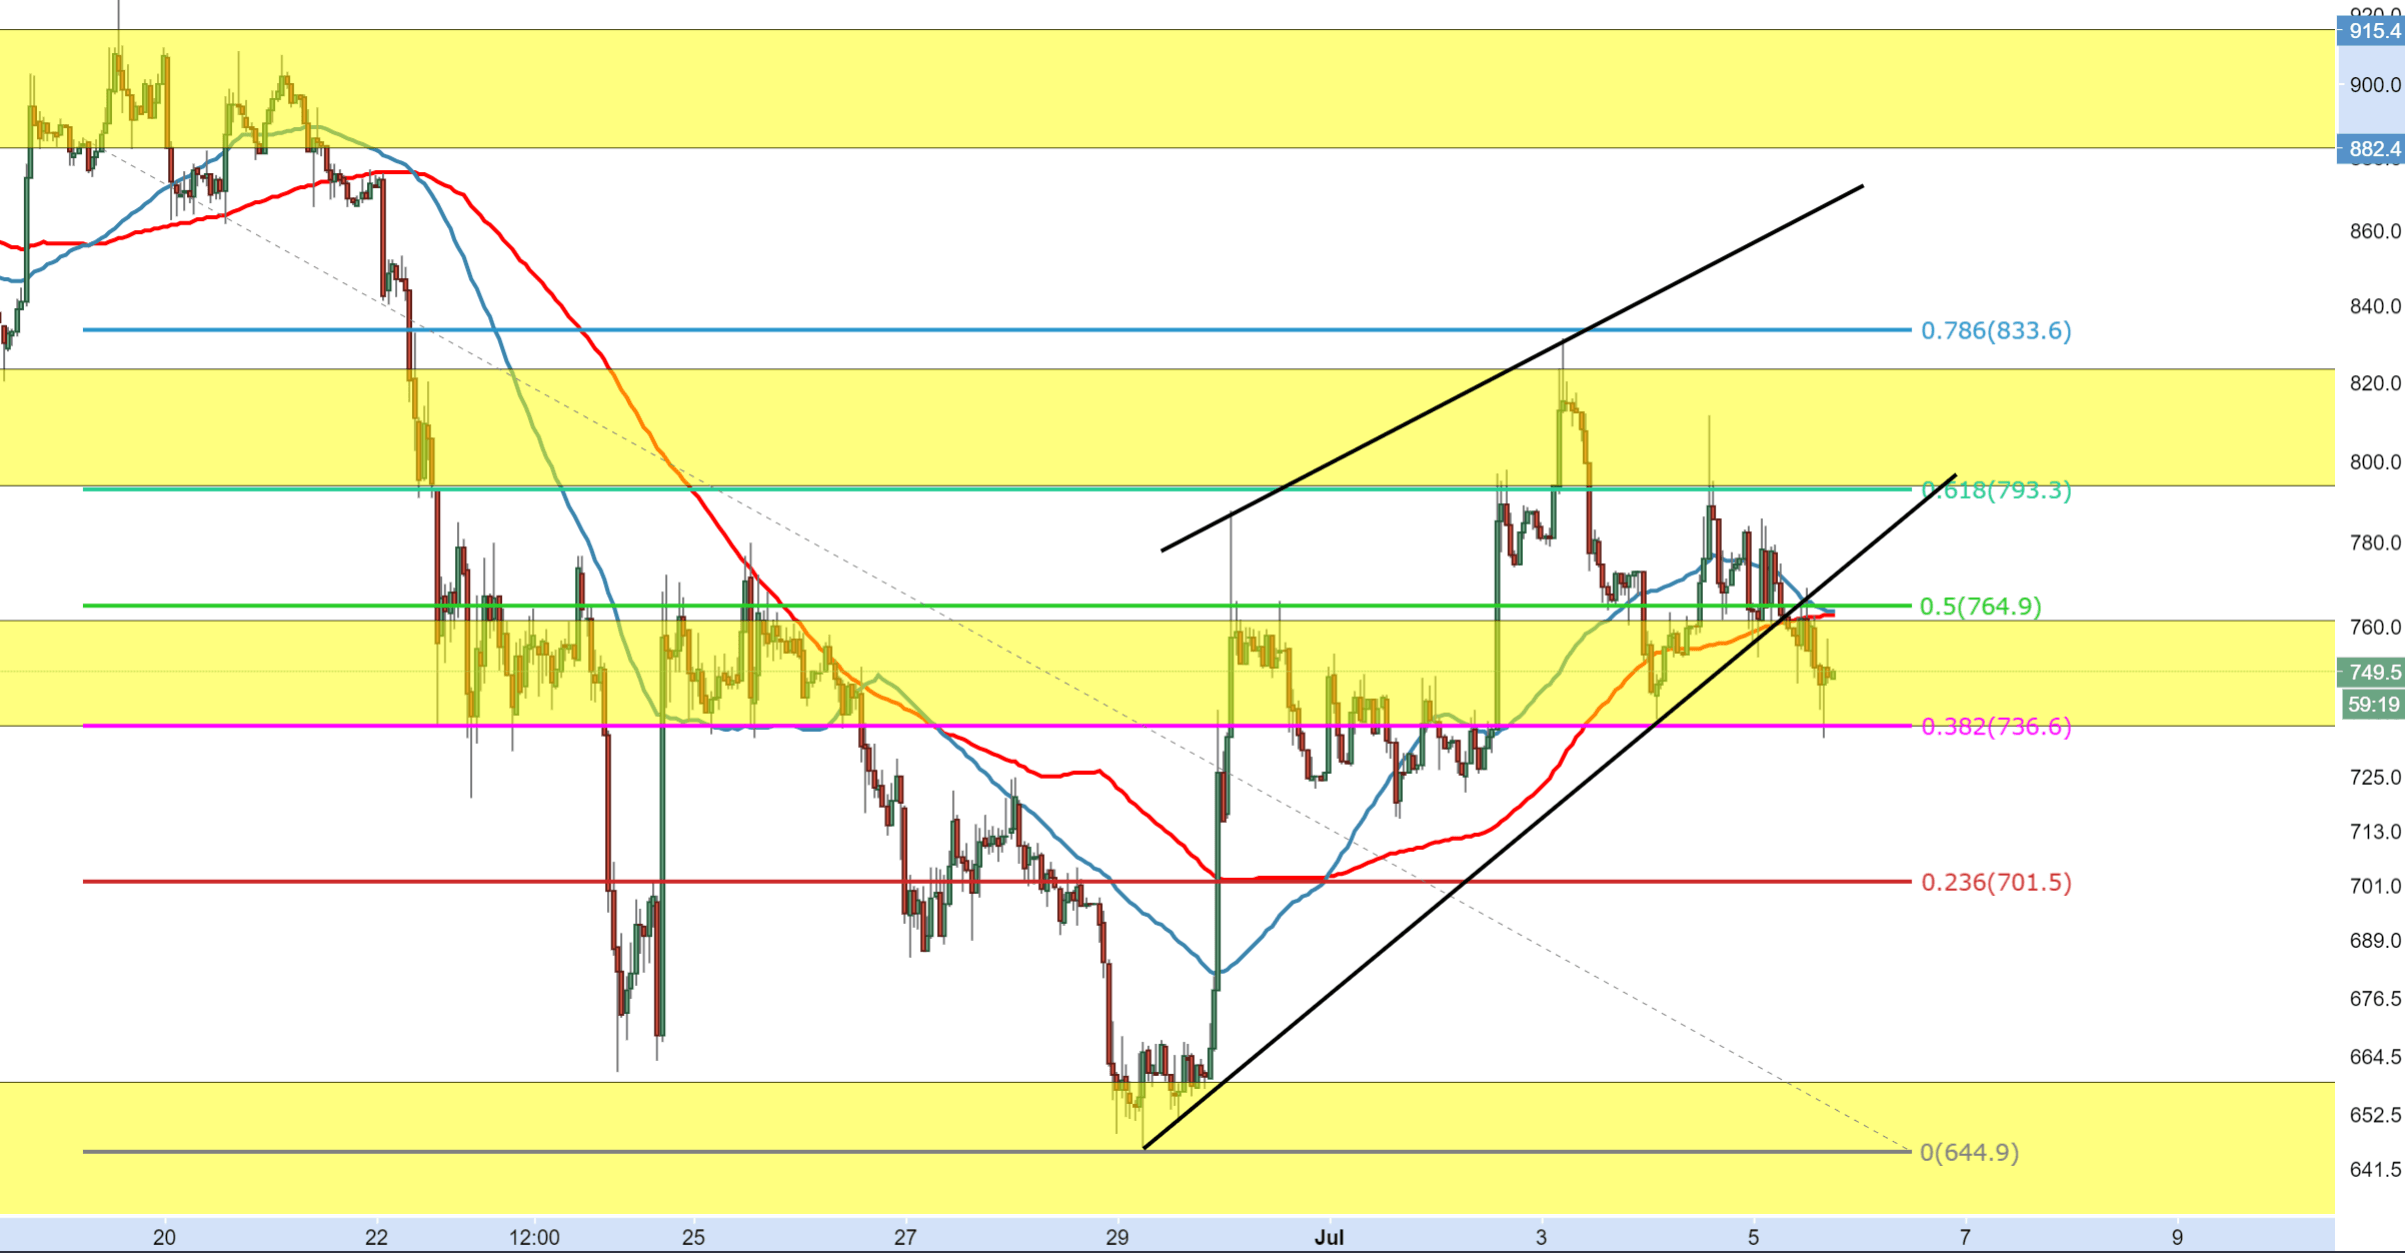


Spot rate:                                     749.7

Relative change:               -1.80%

High:                                                   785.8

Low:                                                      733.7


Trend:                                                 Bearish


Support 1:                                  733.7, today’s (Thursday) low.

Support 2:                                      717.0, (support on 60-minute chart).

Support 3:                                    702.0, 23.6% Fibonacci.

Resistance  1:                          763.0, 50MA & 100MA.

Resistance 2:                          766.5, 50% Fibonacci.

Resistance 3:                          772.0, underneath broken wedge.


FX Street

FX Street

FXStreet is the leading independent portal dedicated to the Foreign Exchange (Forex) market. It was launched in 2000 and the portal has always been proud of their unyielding commitment to provide objective and unbiased information, to enable their users to take better and more confident decisions.