- Bitcoin Cash price was an under performer on Monday down over 3%, with the depressed prices across the market.
- BCH/USD falling price saved by an ascending trend line, running from 21st July.
- The selling pressure looked somewhat exhausted, as the RSI touch oversold territory, a bounce is seen.
BCH/USD 30-minute chart
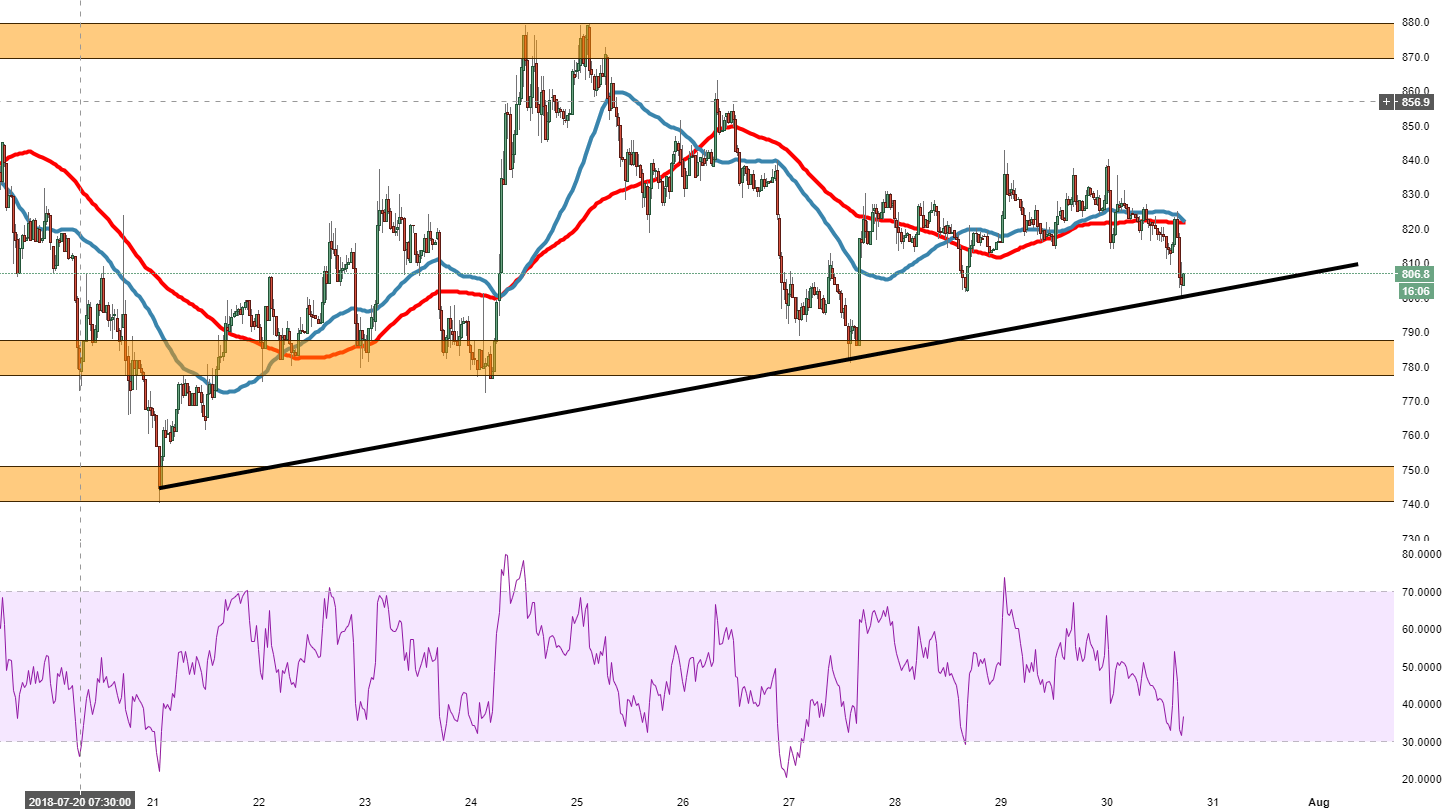
Spot rate: 805.8
Relative change: -3.01%
High: 835.3
Low: 799.2
Trend: Bearish
Support 1: 799.2, ascending trend line & today’s (Monday) low.
Support 2: 787.0, demand zone entrance.
Support 3: 780.7, 27th July low.
Resistance 1: 822.1, 50MA & 100MA.
Resistance 2: 835.9, (resistance on 30-minute chart).
Resistance 3: 842.7, consolidation area & 29th July high.
