- Bitcoin Cash price was seen down a heavy 7% in the latter stages of Monday’s session.
- BCH/USD continues to come under pressure, moving to lowest levels seen since November 2017.
BCH/USD daily chart
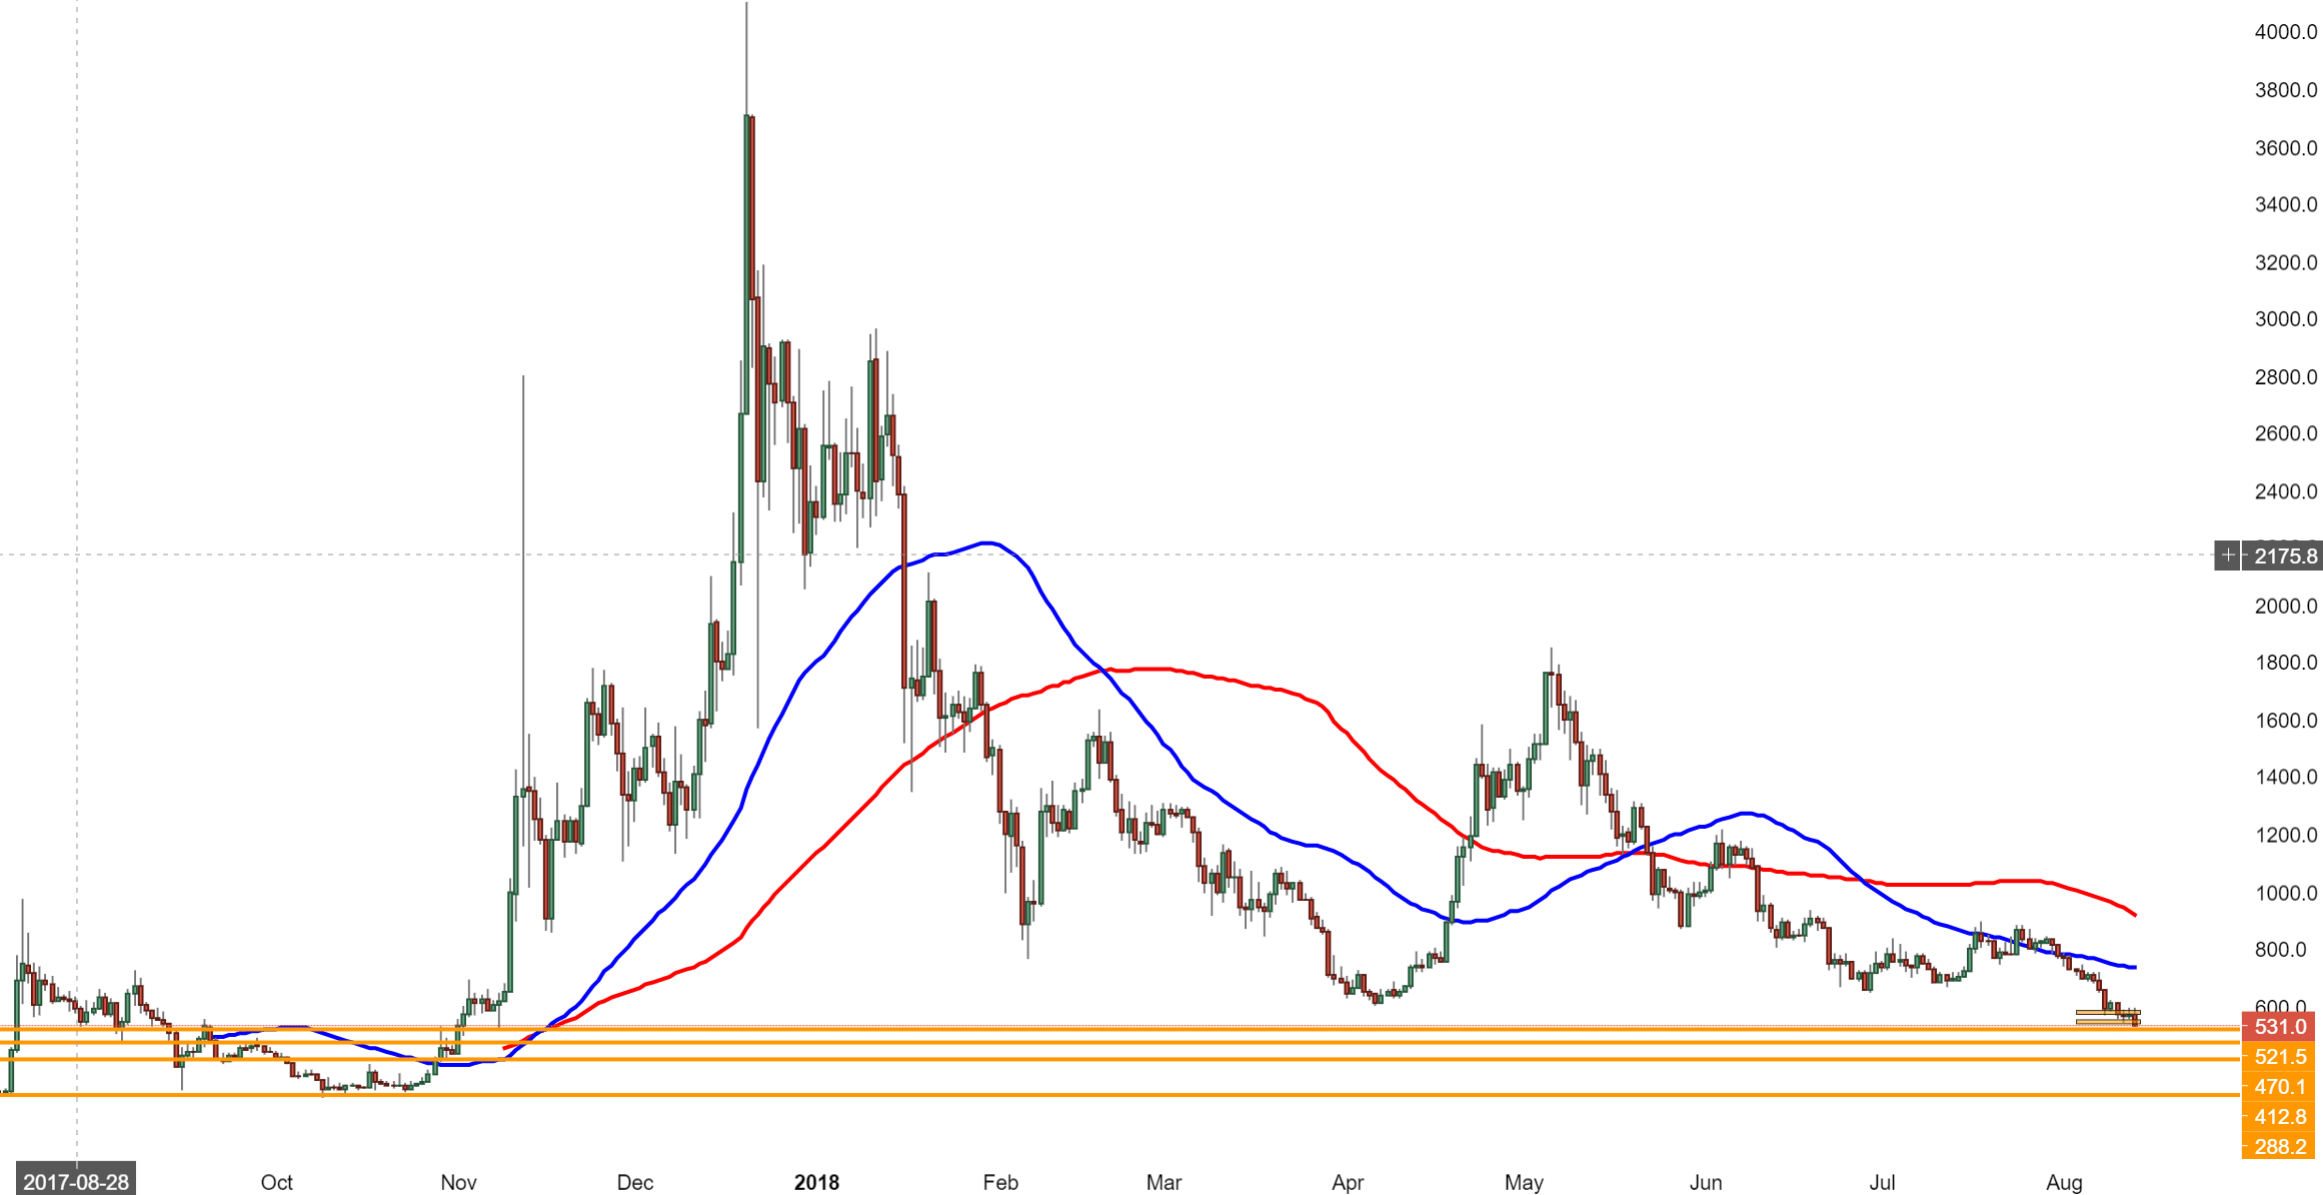
Spot rate: 531.0
Relative change: -7.53%
High: 593.30
Low: 526.0
Trend: Bearish.
Support 1: 521.5, 8th November low prior to 2017 bull run.
Support 2: 470.1, (support on daily chart).
Support 3: 413.1, consolidation area at the end of Oct. 2017.
Resistance 1: 550.0, prior demand zone.
Resistance 2: 590.0, supply area.
Resistance 3: 609.5, (resistance on daily chart).
