- Bitcoin Cash jumped as much as 13% on Tuesday, before losing some steam, but remained up 9%.
- BCH/USD smashed through a descending wedge pattern that has containing upside.
- Chunky resistance tracks from $870-$900, which has given Bitcoin Cash problems on several occasions.
BCH/USD 30-minute chart
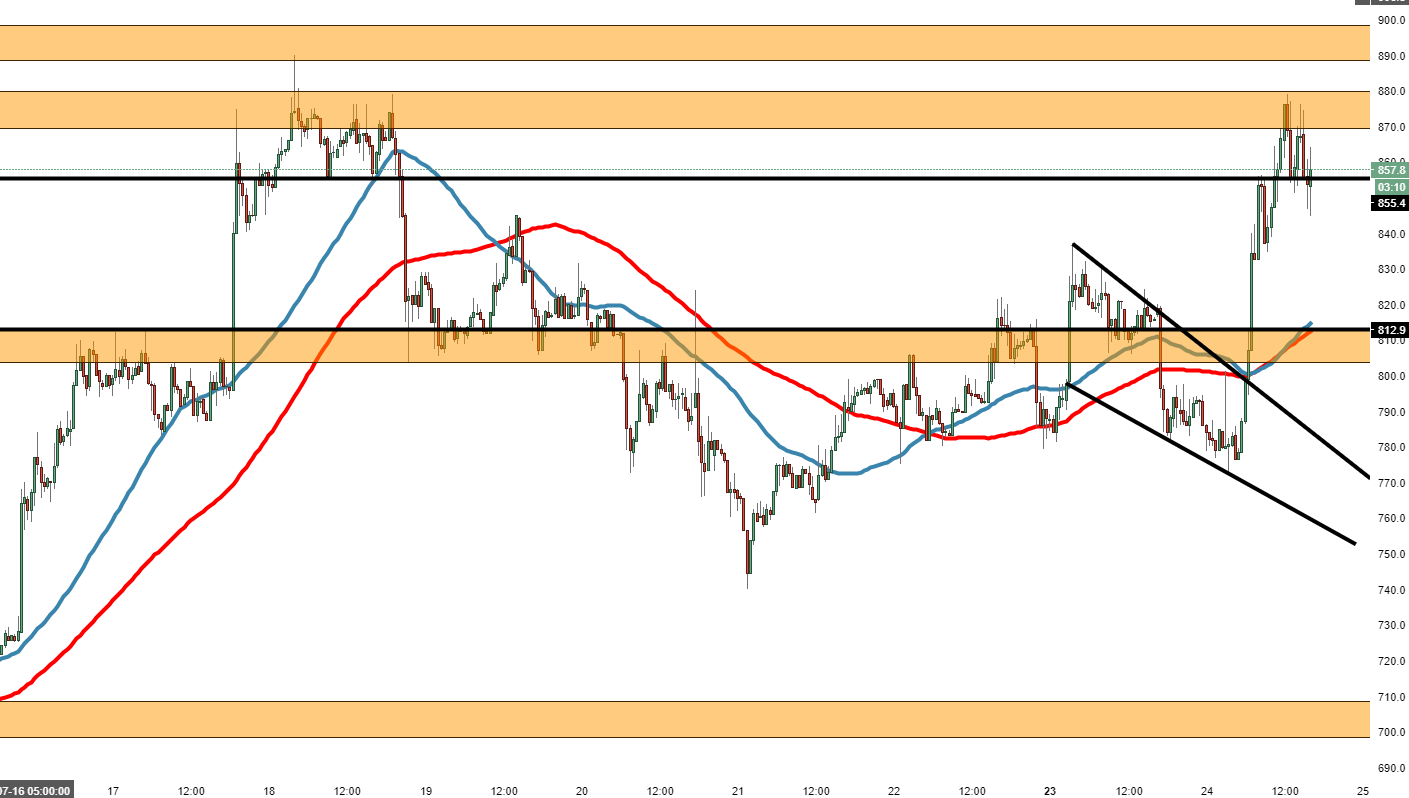
Spot rate: 853.1
Relative change: +9.11%
High: 878.8
Low: 772.0
Trend: Bullish.
Resistance 1: 870.0, entrance to supply zone.
Resistance 2: 878.8, today’s (Tuesday) high.
Resistance 3: 880.0, (resistance on 30-minute chart).
Support 1: 855.5, (support on 30-minute chart).
Support 2: 844.7, 19th July high, demand area.
Support 3: 815.0, 50 & 100MA, demand area.
