- BCH/USD is currently priced at $406.
- The SMA 20 and SMA 50 curves are trending above the daily price chart.
BCH/USD daily chart
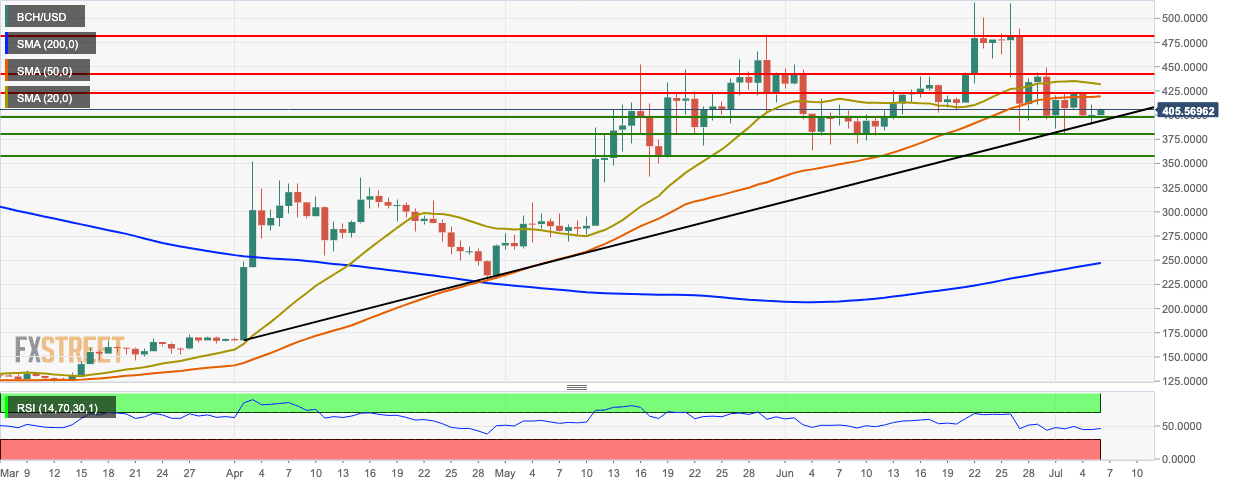
The three latest sessions of the BCH/USD price chart has formed a morning star pattern, which is a bullish sign. It is trending below the 20-day simple moving average (SMA 20) and SMA 50 curves and above the SMA 200 curve. The relative strength index (RSI) indicator is trending around 50 in the neutral zone.
BCH/USD 4-hour chart
-636979768523823801.png)
The 4-hour BCH/USD is trending below the green Ichimoku cloud. The 4-hour market found support on the $400-level and needs to next negotiate with the $410 resistance level. The Elliot oscillator has had three straight bullish sessions, following six consecutive bearish sessions.
BCH/USD hourly chart
-636979767938340147.png)
The hourly BCH/USD is trending in the upper-half of the 20-day Bollinger band. The Bollinger jaw is also narrowing, which shows decreasing market volatility. The two latest price sessions are trending in a flag formation, getting primed for a breakout. The hourly market is below the SMA 200 and SMA 50 curves, while it is above the SMA 20 curve. The moving average convergence/divergence (MACD) indicator has had 16 straight bullish sessions of increasing intensity.
Key Levels
