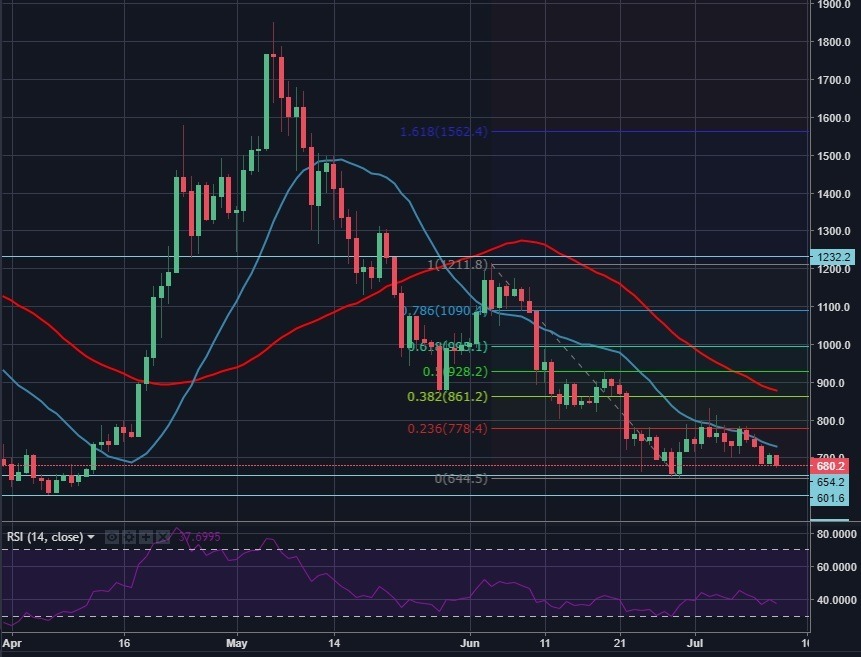
- BCH/USD refreshes two week low at $672, starts consolidating daily losses in a tight range below the $700 mark.
- The RSI on the daily chart fails to recover above 40, suggests that yesterday’s rise was not good enough to scare off the bears.
- With a break below $650, the pair could extend losses toward a fresh 2018 low near $600.
Spot rate: 680
Relative change: -3.66%
High: 706
Low: 672
Trend: Bearish
Support 1: 650 (Jun 28/Jun. 29 low).
Support 2: 600 (Apr. 4/5 low/2018 low).
Support 3: 520 (Nov. 9, 2017, low).
Resistance 1: 730 (20-DMA).
Resistance 2: 780 (Fibo. %23.6 retracement of Jun. 3 – 29 fall).
Resistance 3: 860 (Fibo. %38.2 retracement of Jun. 3 – 29 fall).
