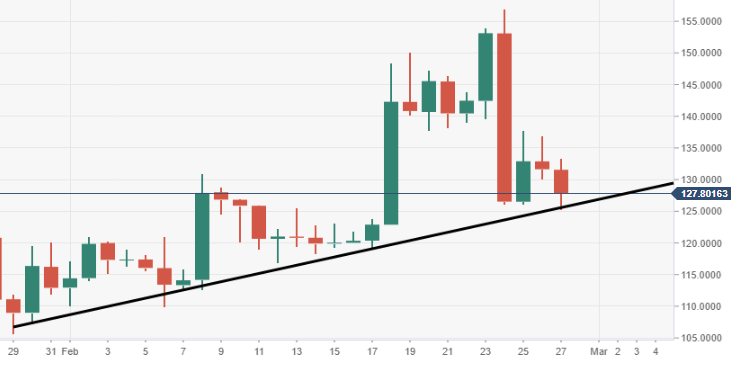
- Bitcoin Cash price into the late on Wednesday is nursing losses of some 3%.
- BCH/USD bears are testing a critical near-term ascending trend line of support to the downside.
Spot rate: 127.82
Relative change: -3.02%
High: 133.32
Low: 125.89
Trend: Bearish
Trends:
Daily SMA20: 129.8056
Daily SMA50: 128.6577
Daily SMA100: 147.353
Daily SMA200: 326.4031
Levels:
Previous Daily High: 136.9153
Previous Daily Low: 130.032
Previous Weekly High: 150.0785
Previous Weekly Low: 119.129
Previous Monthly High: 174.9558
Previous Monthly Low: 104.8742
Daily Fibonacci 38.2%: 132.6614
Daily Fibonacci 61.8%: 134.2859
Daily Pivot Point S1: 128.8055
Daily Pivot Point S2: 125.9771
Daily Pivot Point S3: 121.9222
Daily Pivot Point R1: 135.6888
Daily Pivot Point R2: 139.7437
Daily Pivot Point R3: 142.5721
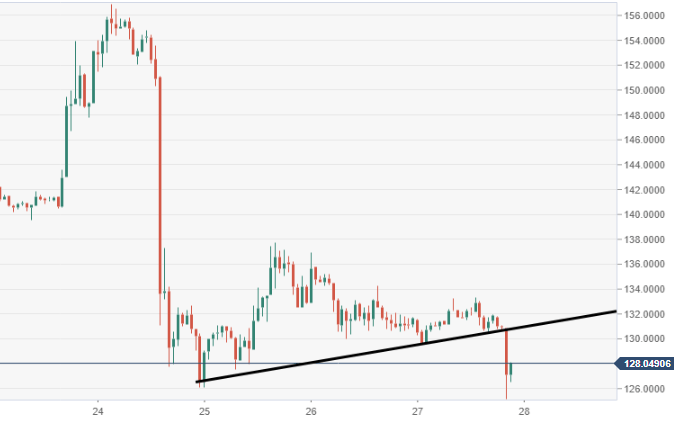
BCH/USD 60-minute chart
A near-term supporting trend line has been breached via the 60-minute view, inviting a wave of selling.
BCH/USD daily chart
- A near-term ascending trend line that has been in play since the back end of January is under threat.