- Bitcoin Cash price on Monday is nursing losses of over 2% towards the latter part of the session.
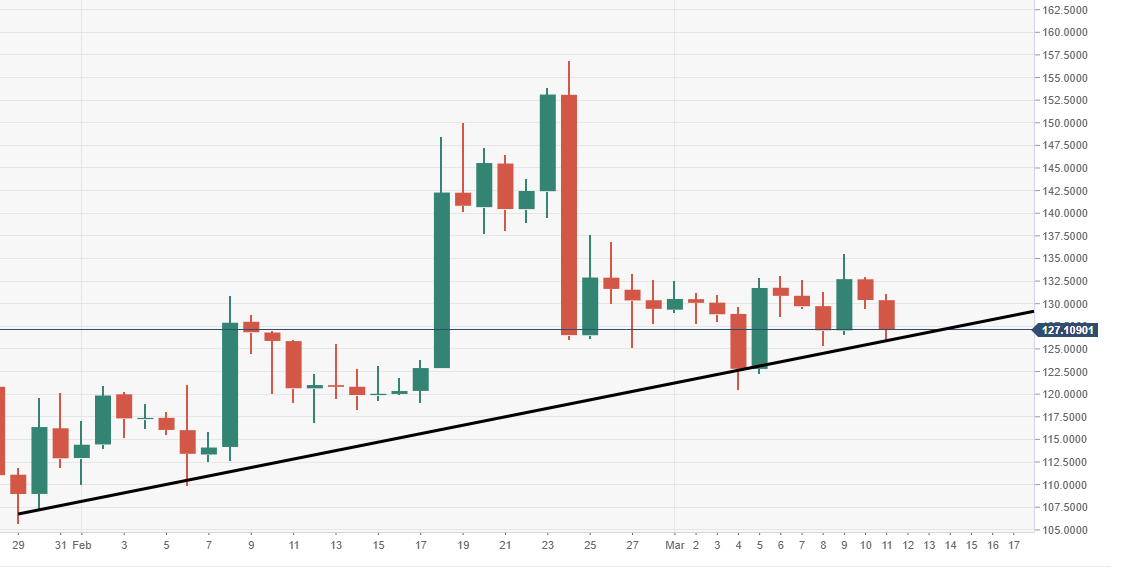
- BCH/USD like many of its peers is testing an important daily ascending trend line of support if breached could see a chunky wave of selling pressure.
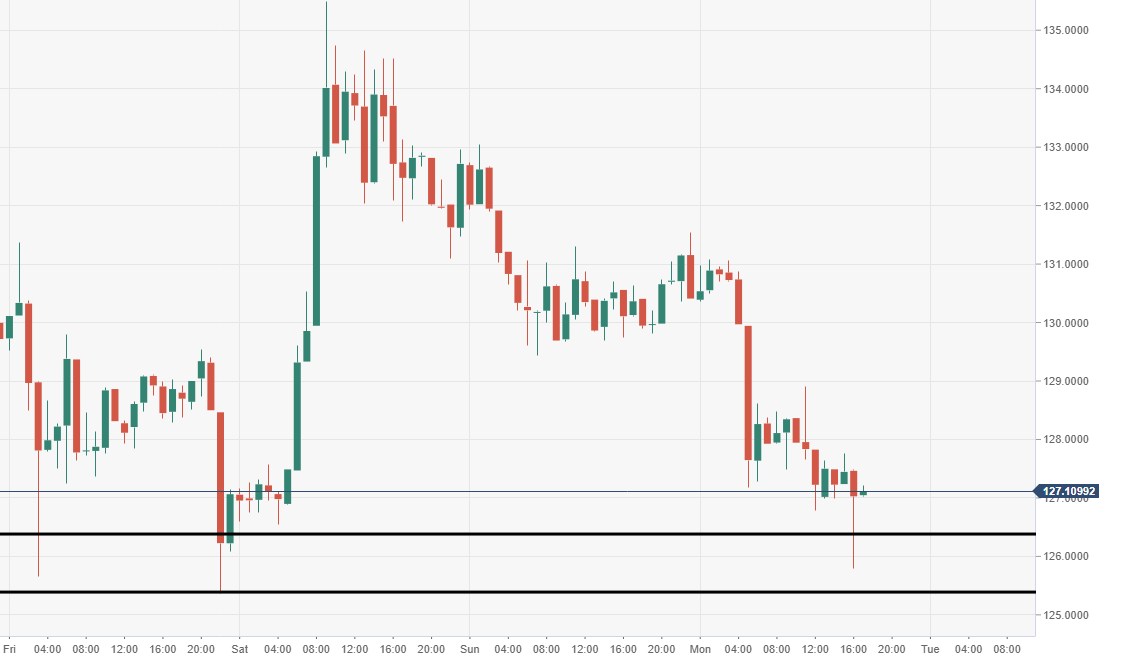
- Buyers continue to maintain interested near-term via the 60-minute view within the range of $125-126.
Spot rate: 127.10
Relative change: -2.30%
High: 131.07
Low: 125.79
Trends:
Daily SMA20: 133.401
Daily SMA50: 126.3212
Daily SMA100: 133.8729
Daily SMA200: 300.6954
Levels:
Previous Daily High: 133.0369
Previous Daily Low: 129.4368
Previous Weekly High: 133.068
Previous Weekly Low: 120.5261
Previous Monthly High: 156.9334
Previous Monthly Low: 109.9144
Daily Fibonacci 38.2%: 130.8121
Daily Fibonacci 61.8%: 131.6617
Daily Pivot Point S1: 128.8855
Daily Pivot Point S2: 127.3611
Daily Pivot Point S3: 125.2854
Daily Pivot Point R1: 132.4856
Daily Pivot Point R2: 134.5613
Daily Pivot Point R3: 136.0857
BCH/USD 60-minute chart
Near-term buying observed around $125-126 price territory, a breach could open the door to a fresh wave of selling.
BCH/USD daily chart
- The price is hugging the critical ascending trend line, support tracking at $125 via the daily.