- Bitcoin Cash price drops over 6% in the session on Monday, one of the notable under-performers on the day.
- BCH/USD testing a vital near-term demand zone to the downside.
- Should the bears breach $400 territory, this could open up the gates to further heavy selling pressure.
- Price trading at lowest levels since 19th September, with large pick up in trading volumes seen.
BCH/USD daily chart
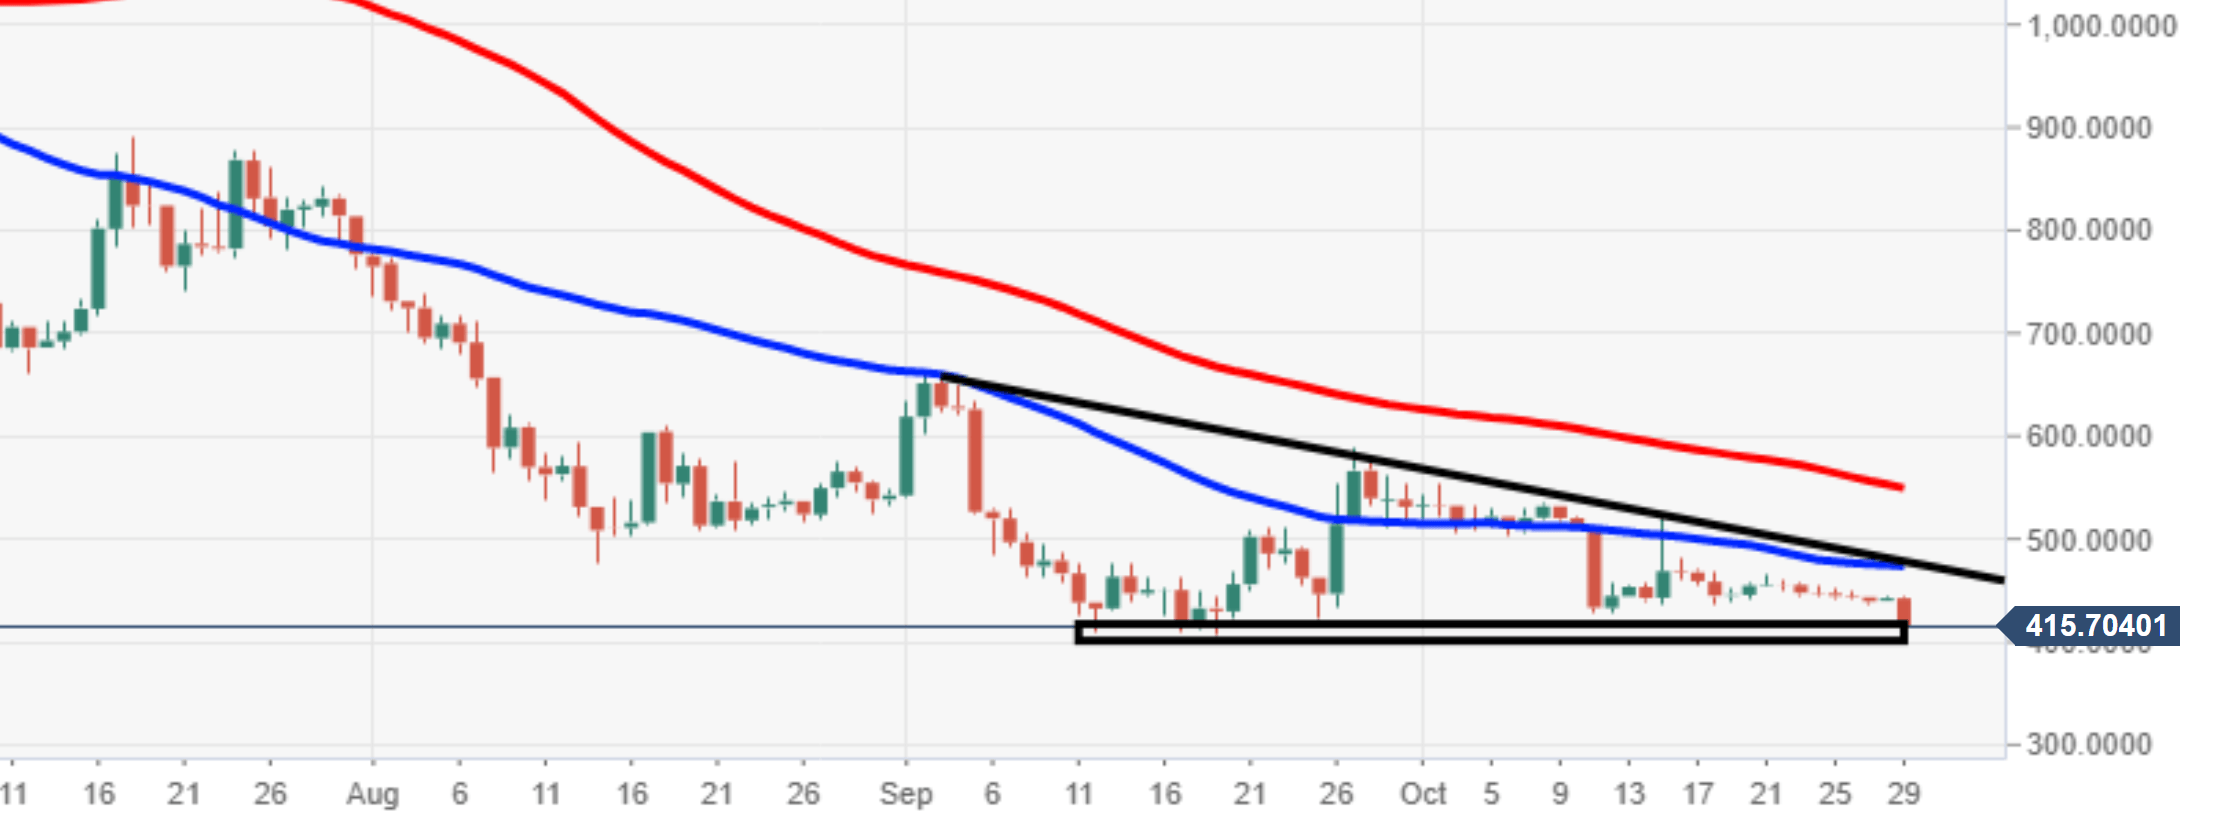
Spot rate: 415.8
Relative change: -6.03%
High: 443.2
Low: 438.0
Trend: Bearish
Support 1: 408.7, 19th September low.
Support 2: 405.0, demand zone.
Support 3: 400.0, psychological support.
Resistance: 444.5, daily R1.
Resistance: 446.5, daily R2.
Resistance: 449.7, daily R3.
