- Bitcoin and Ethereum recorded two bearish months in a row.
- Ripple recorded its third bearish month in a row.
BTC/USD daily chart
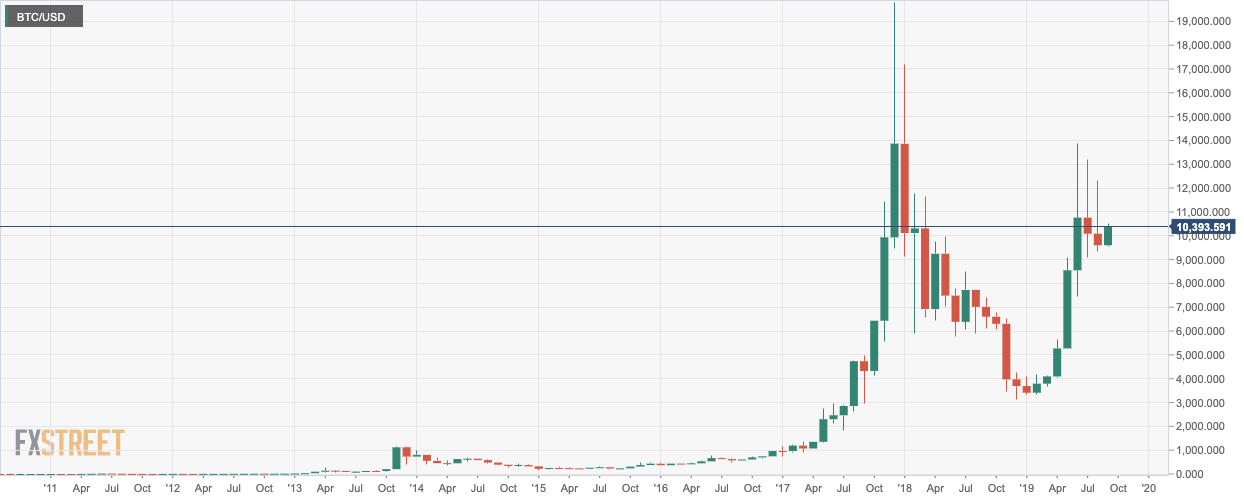
The BTC/USD monthly chart managed to have five straight bullish months before the bears stepped in for two months in a row. This August, the price of Bitcoin fell from $10,124 to $9,654, charting a high of $12,343. BTC/USD has had a bullish start to September.
ETH/USD daily chart
-637030838876646957.png)
ETH/USD has had five straight bullish months before charting two consecutive bearish months. Over the last two months, the price of ETH/USD fell from $293.65 to $172 – dropping by 41.45%.
XRP/USD daily chart
-637030838479136254.png)
XRP/USD managed to have two straight bullish sessions before succumbing to three consecutive bearish sessions. During these three months, the price of XRP/USD fell from $0.446 to $0.265, going down by 40.60%.
