- The 20-day Bollinger Band has widened, which shows increasing price volatility.
- The price is floating below the SMA 20, SMA 50 and SMA 200 curves.
BTG/USD daily chart
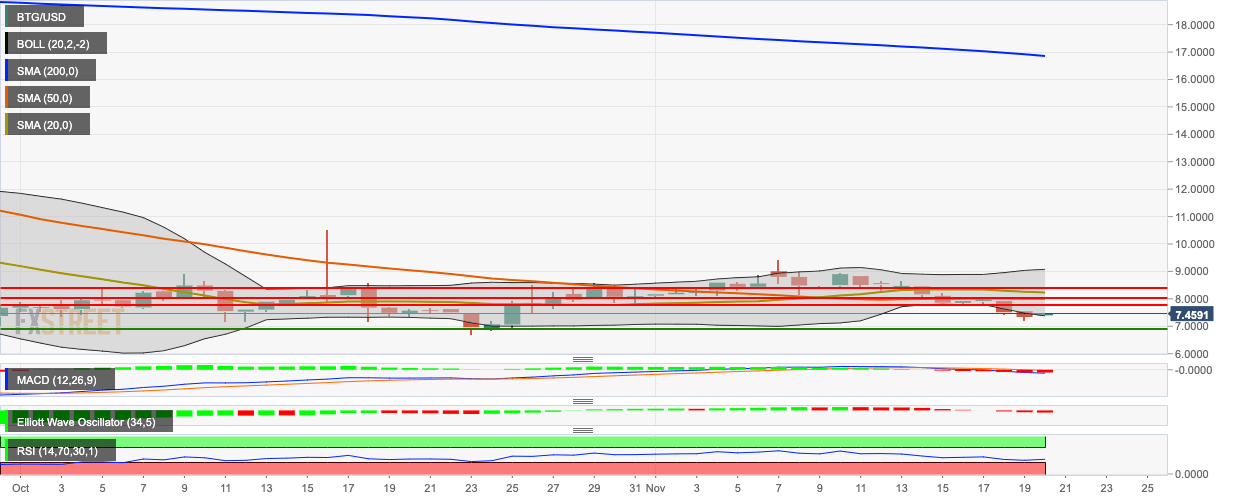
BTG/USD has gone up from $7.40 to $7.45 this Wednesday and is floating below the 20-day Simple Moving Average (SMA 20), SMA 50 and SMA 200 curves. The 20-day Bollinger jaw has widened, indicating increasing market volatility. The Elliott Oscillator has had six straight red sessions and the Moving Average Convergence/Divergence (MACD) indicates increasing bearish momentum. The Relative Strength Index (RSI) indicator is trending around 39.10, next to the oversold zone.
