- BTG/USD is trending in a downward channel formation.
- The market has found support on the SMA 20 curve.
BTG/USD daily chart
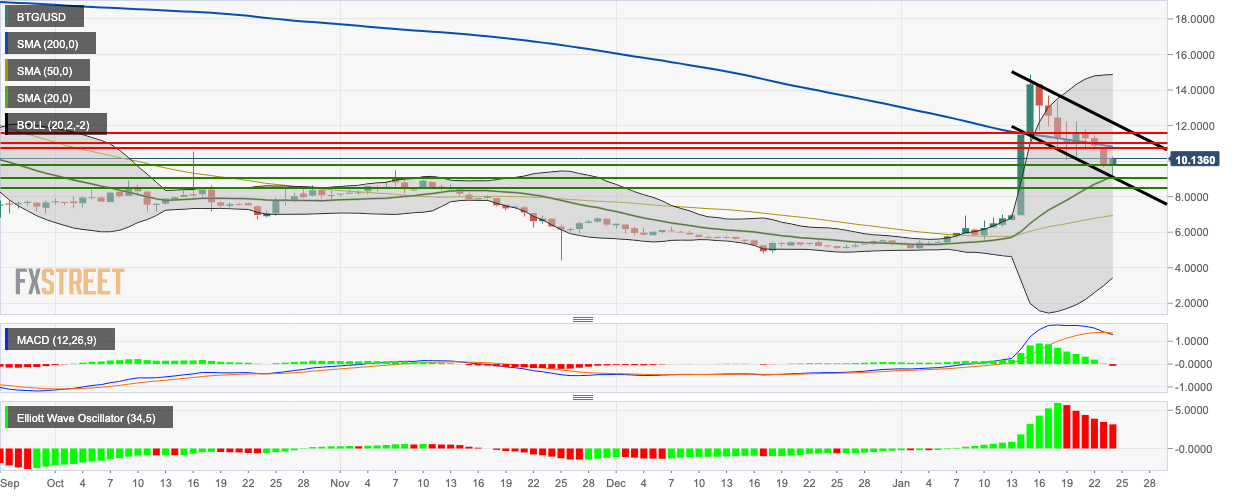
After three straight bearish days, BTG/USD buyers came back into the market to take the price from $9.74 to $10. The price is trending in a downward channel formation and has found support on the SMA 20 curve. The SMA 200 curve acts as immediate market resistance and holding the price down. The MACD indicator shows that market momentum has reversed from bullish to bearish, while the Elliott Oscillator has had six straight red sessions. Both of these indicators show that the overall market sentiment is presently bearish.
