- BTG/USD fell from $7.40 to $7.11 this Thursday and has since fallen below $7.
- The MACD indicator shows decreasing bearish momentum.
BTG/USD daily chart
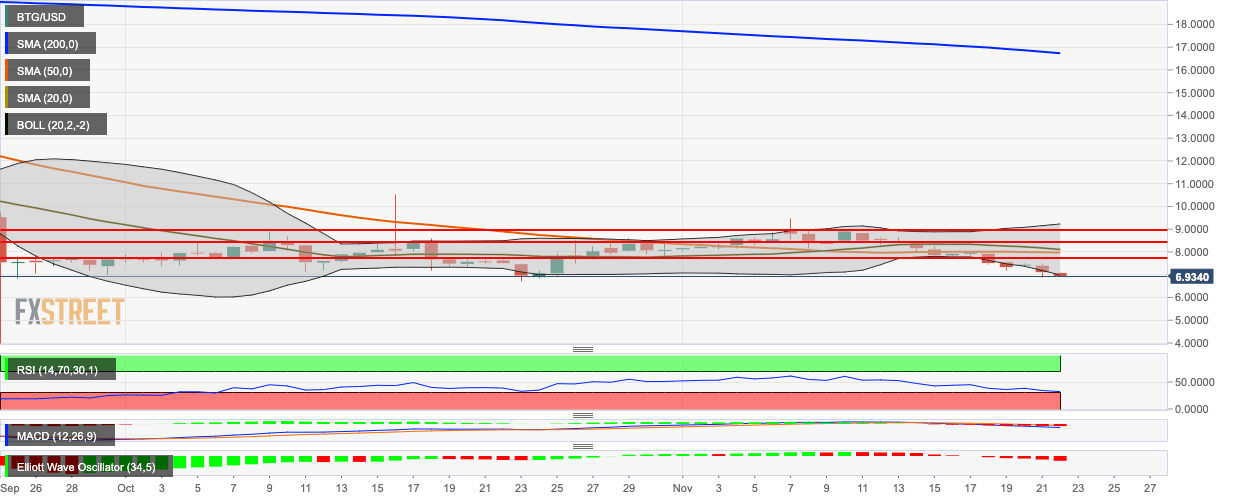
The 20-day Bollinger jaw has widened, indicating increasing price volatility. The price is currently negotiating with the lower Bollinger curve. The Moving Average Convergence/Divergence (MACD) indicates increasing bearish momentum, while the Elliott Oscillator has had 12 straight red sessions. The Relative Strength Index (RSI) indicator is trending around 32.35, next to the oversold territory.
