- The Elliott Oscillator has had a green session following nine consecutive red sessions.
- The SMA 200 is on the verge of crossing over the SMA 20 to chart the bearish death cross pattern.
BTG/USD daily chart
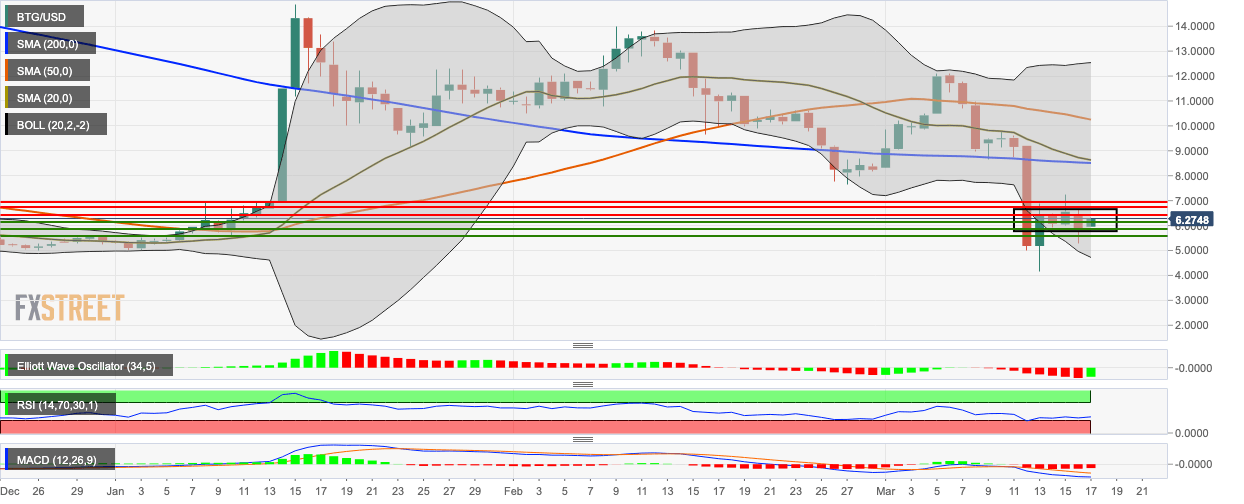
BTG/USD had a bullish start to this Tuesday as the price spiked from $5.87 to $6.27. The bulls are aiming to recover Monday’s losses where the price of BTG/USD dropped from $6.46 to $5.87. The SMA 200 is on the verge of crossing over the SMA 20 to chart the bearish death cross pattern indicating that the sellers may eventually take back control in the coming days.
The MACD shows sustained bearish momentum, while the RSI indicator has gone up slightly from 35 to 37.80 this Tuesday. The Elliott Oscillator has had a green session following nine consecutive red sessions.
