- According to the Hash Ribbon, on-chain metric, Bitcoin is on the cusp of another rally.
- The Hash Ribbon shows when the worst of miner capitulation is coming to an end.
Bitcoin has slowed down the uptrend after running in immense selling pressure under $19,500. The flagship cryptocurrency has settled around $19,000, awaiting the final leg to new all-time highs beyond $20,000. Meanwhile, Glassnode’s Hash Ribbon on-chain indicator is almost presenting a buy signal since July.
Bitcoin Hash Ribbon turns strongly bullish
The Hash Ribbon, an on-chain indicator developed by Charles Edwards and presented by Glassnode, suggests that the flagship cryptocurrency tends to hit bottom during miner capitulation. In other words, this is the time “when Bitcoin becomes too expensive to mine relative to the cost of mining.”
Glassnode explains that the miner capitulation ends “when the 30-day Moving Average of the hash rate crosses above the 60-day MA” (observe the chart below for the shift from light red to dark red areas).
Immediately after the switch happens, the momentum of Bitcoin price changes from negative to positive. The indicator presents a considerable buying opportunity following the shift from dark red to white.
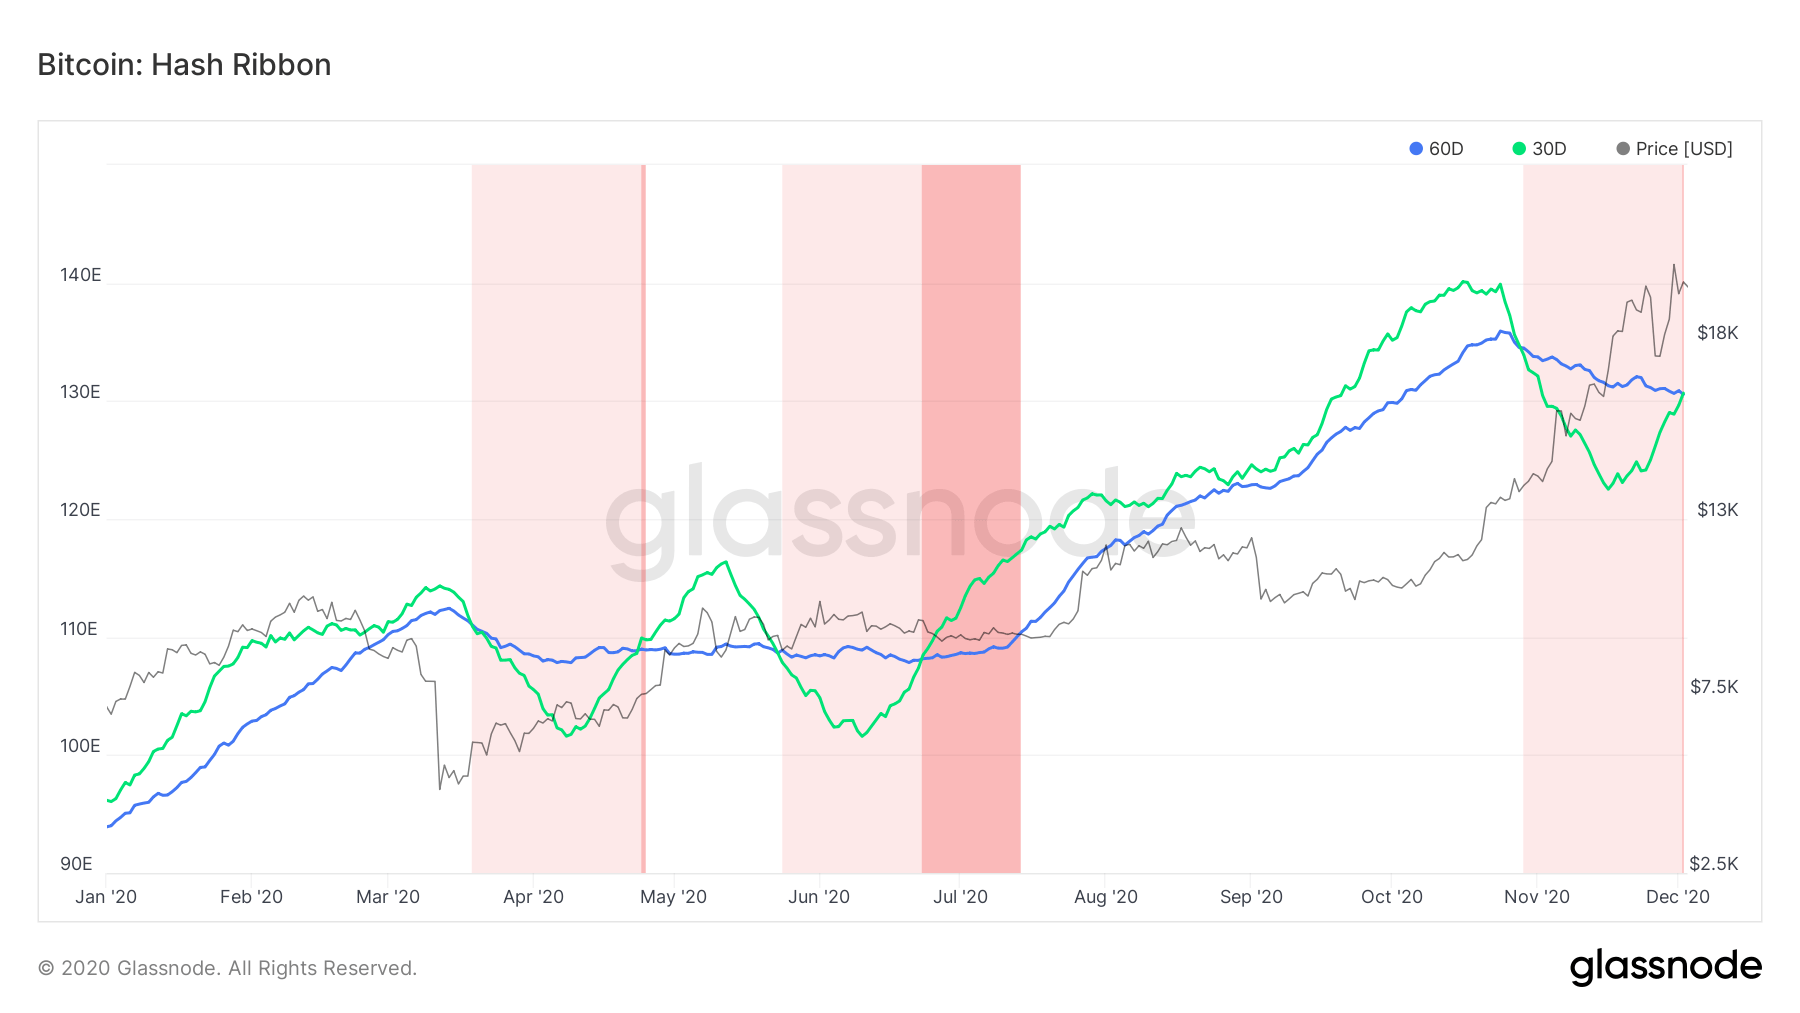
Bitcoin Hash Ribbon chart
As mentioned above, a buy signal nears when the 30-day MA crosses above the 60-day MA. The chart below highlights this imminent move, as well as a shift from the light red ribbon to the white ribbon. In other words, investors should prepare for a possible liftoff for Bitcoin, perhaps to levels significantly above $20,000.
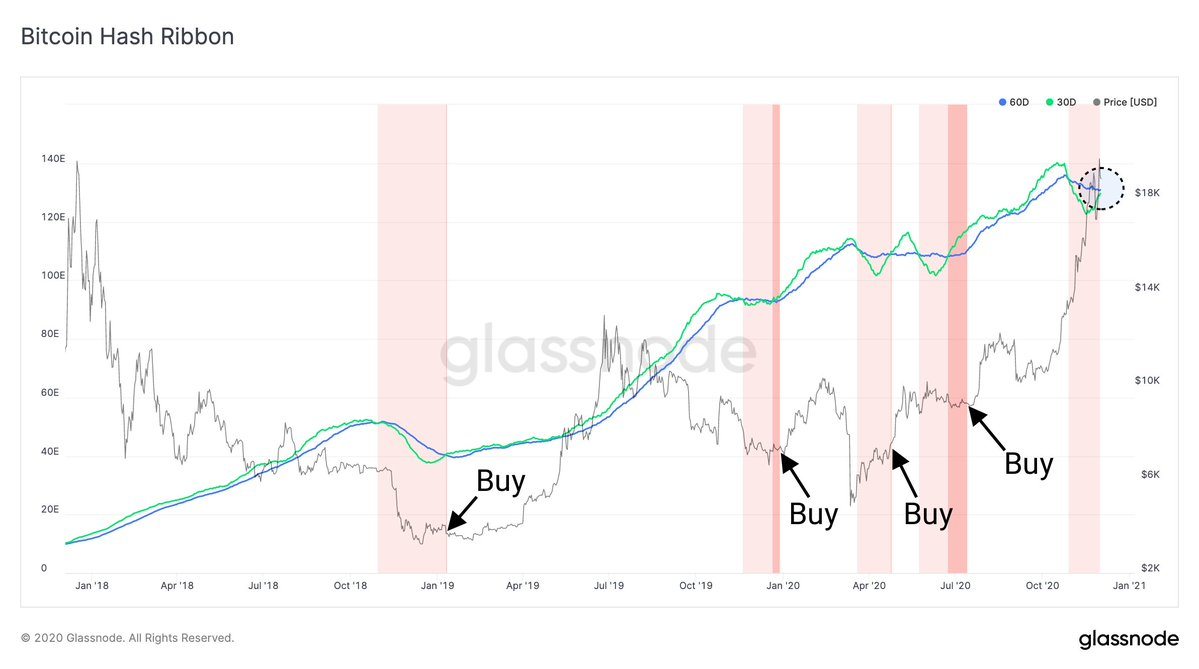
Bitcoin Hash Ribbon chart
IntoTheBlock’s IOMAP chart adds credibility to the bullish outlook by revealing the lack of formidable resistance heading to $20,000. The most robust hurdle runs from $19,272 to $19,310. Here, 311 addresses had previously purchased roughly 2,700 BTC.
-637425717087691394.png)
Bitcoin IOMAP chart
On the flip side, immense support is accorded to the bellwether cryptocurrency. Thus it is doubtful that massive losses will come into the picture in the near term. For now, the most substantial buyer congestion zone lies between $18,558 and $19,118. Here, 1.4 million addresses had previously purchased approximately 792,000 BTC.
It is worth mentioning that short-term analysis for BTC/USD brings to light a worsening technical picture. The bullish outlook will be invalidated if BTC closed the day under the short term ascending trendline support and the critical level at $19,000.
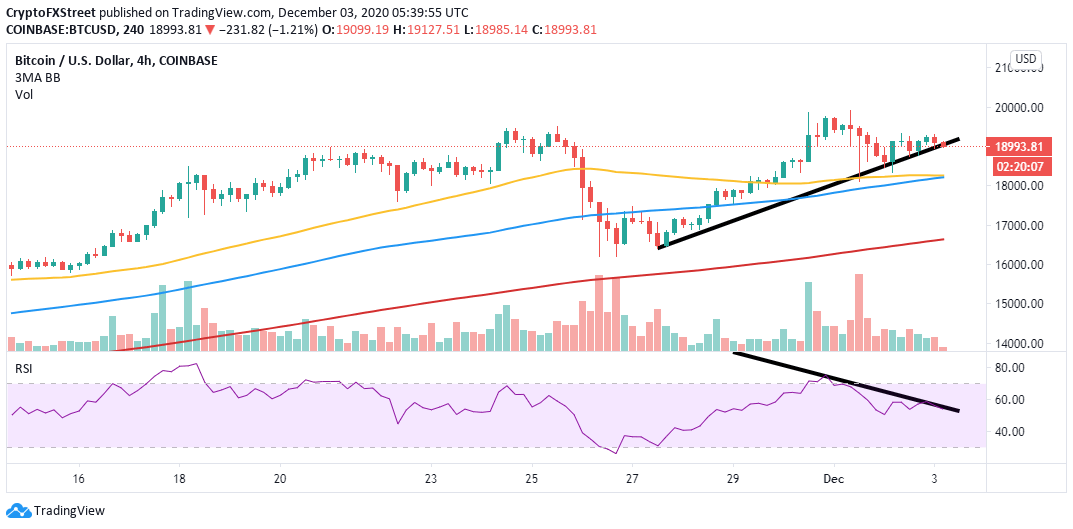
BTC/USD 4-hour chart
Similarly, a bearish divergence has been formed by the Relative Strength Index and the price, suggesting that buying pressure is decreasing. Bearish divergences are created when the RSI sustains a lower high pattern while the price prints a higher low pattern.
As the bullish momentum dwindles, bears gain more control over the price, which may eventually push Bitcoin to spiral to $18,000 and $16,000, respectively.
