- Bitcoin could be on the verge of a massive correction according to an indicator.
- Some people believe Bitcoin could still climb higher before a pullback.
Many analysts and traders have attempted to accurately determine the Bitcoin top. One of the most common ways is using past price history. In 2017, Bitcoin price experienced a 20x before a massive crash down to $3,000.
Is Bitcoin on the verge of a massive crash?
According to Big Chonis, a popular trader on Twitter, Bitcoin’s price action seems to be similar to what happened at the beginning of 2018. This would indicate that the flagship cryptocurrency could be looking for a huge pullback.
Big Chonis uses the TD Sequential indicator to prove his theory. It seems that at the beginning of 2018, the TD presented a sell signal followed by a green ‘1’ candle. The same has happened now which could mean that Bitcoin is poised for a correction.
However, not everyone agrees as the TD Sequential indicator has presented this pattern several times before. The second theory would suggest that we are only at the beginning of Bitcoin’s rally.
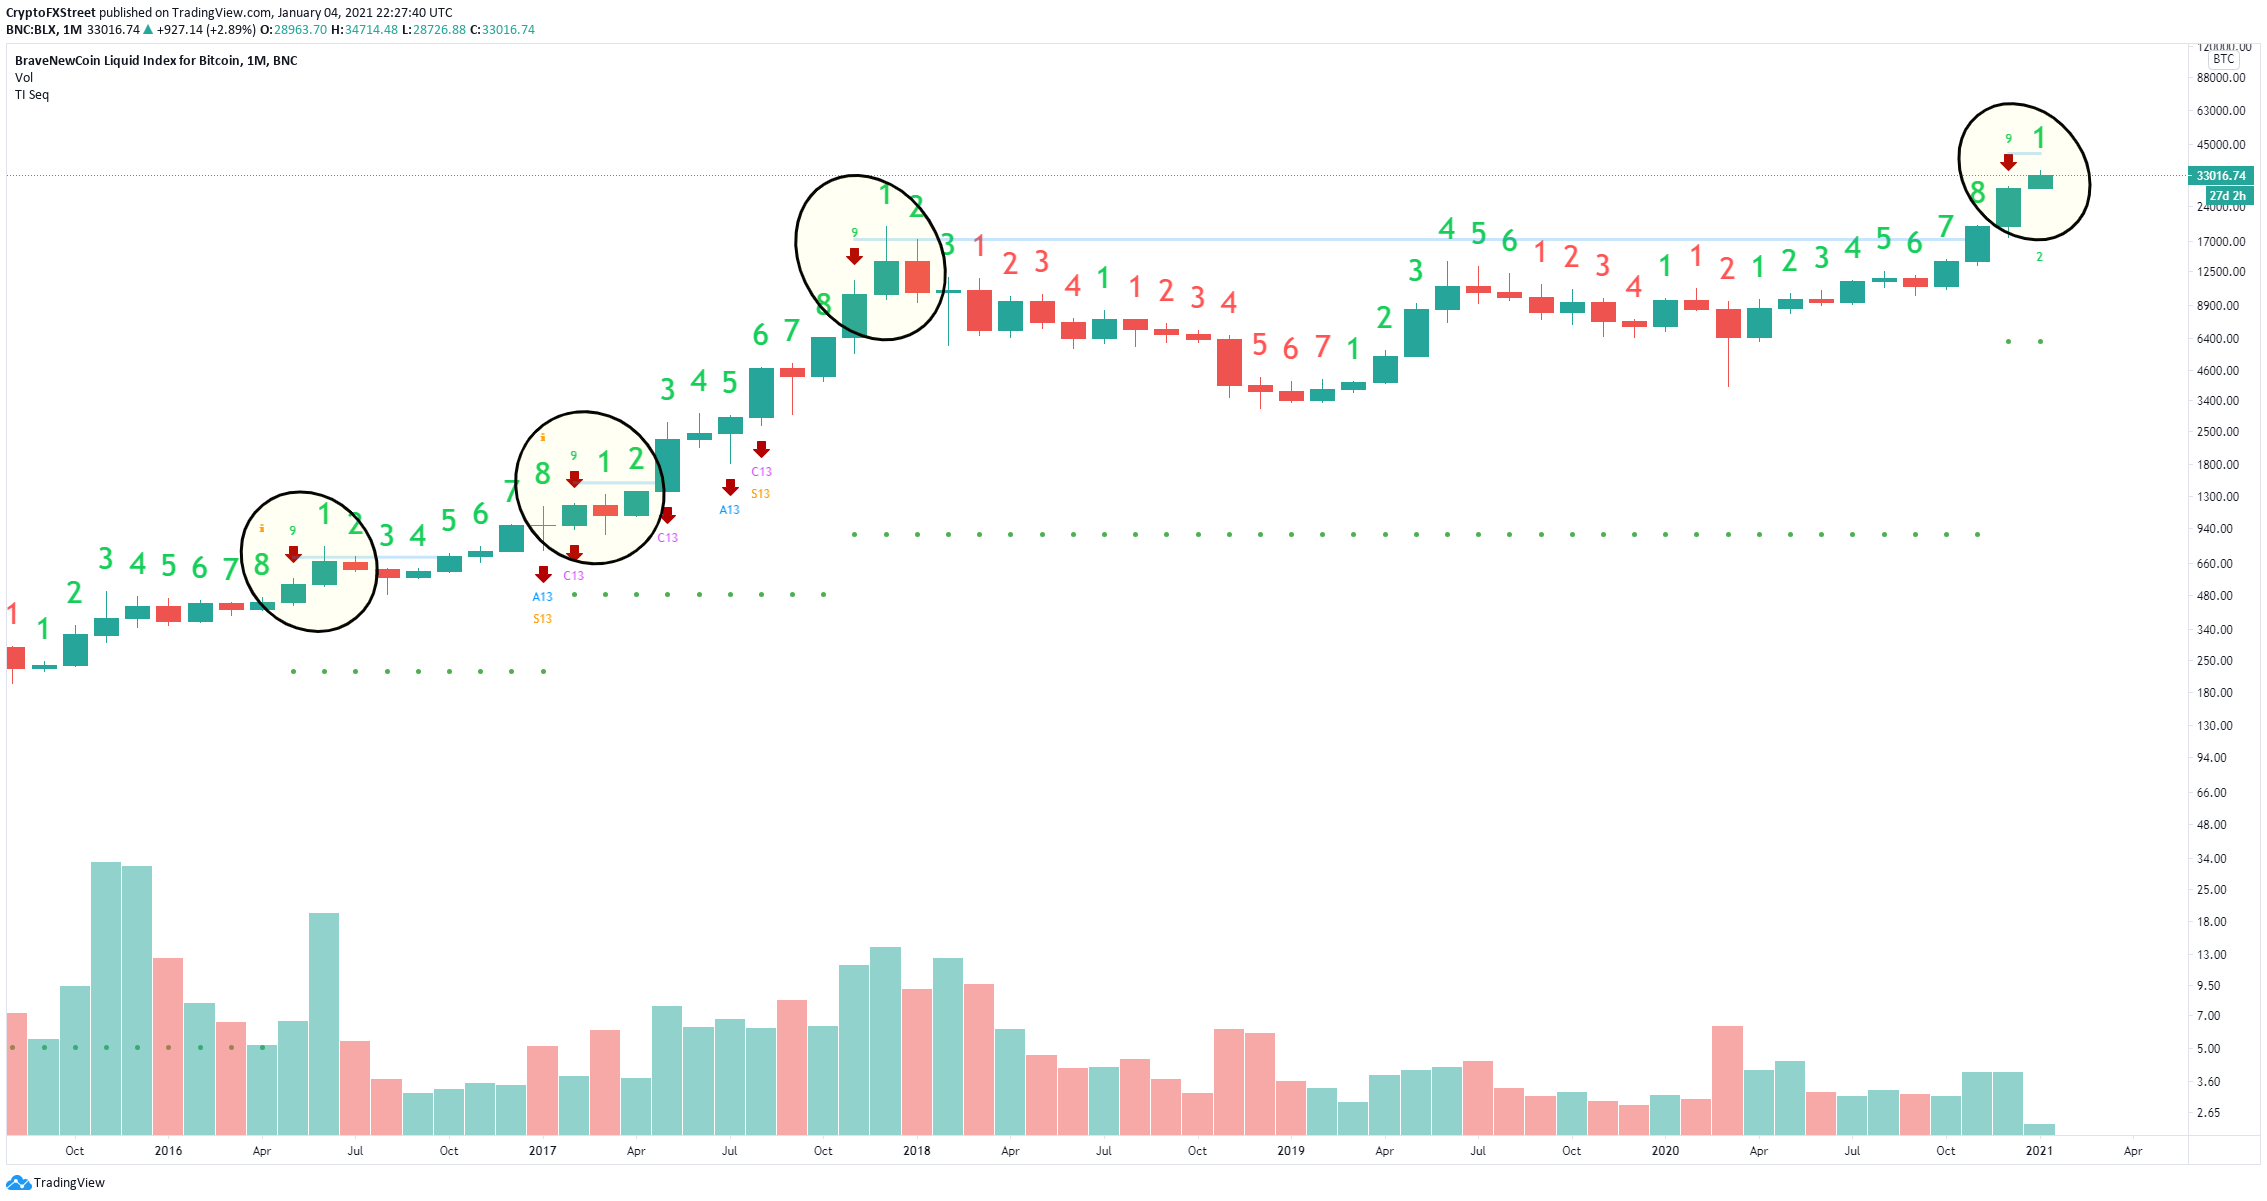
BTC/USD monthly chart
This is the first time the TD Sequential indicator has presented a sell signal on the monthly chart since November 2017. Before the major rally in 2017, the TD Sequential presented two sell signals on May 2016 and February 2017, both followed by a green ‘1’ candle.
