- Bitcoin struggles to extend recovery above 10k following a bearish start.
- Technical set up continues to favor bears, 9,800 still on sight.
Bitcoin (BTC/USD), the most favorite cryptocurrency, resumes its recent bearish momentum following Thursday’s dead cat bounce, having breached the 10k mark earlier on Saturday to hit two-day lows of 9,960. There was no fundamental reason behind the sudden drop, as it was a technically driven move, with fresh stop triggered below a break above of the key 10,000 figure.
Meanwhile, quiet trading prevails across the crypto space so far this Saturday, with the No. 1 coin still vulnerable to bearish sentiments, despite the quick pullback above the 10k handle. At the press time, the rates are seen consolidating the V-shaped reversal to 10,100 levels, down over 1% during the last 24 hours, and with a market capitalization of $ 181.22 billion.
Technically, the first coin displayed a symmetrical breakdown on the hourly chart early-Saturday that triggered a sharp drop. Although the rates staged a quick comeback, helped by the hourly Relative Strength Index lying heavily in the oversold territory. Over the last hours, the bulls are struggling to extend the recovery momentum, as the set up still suggests that the further downside remains in play.
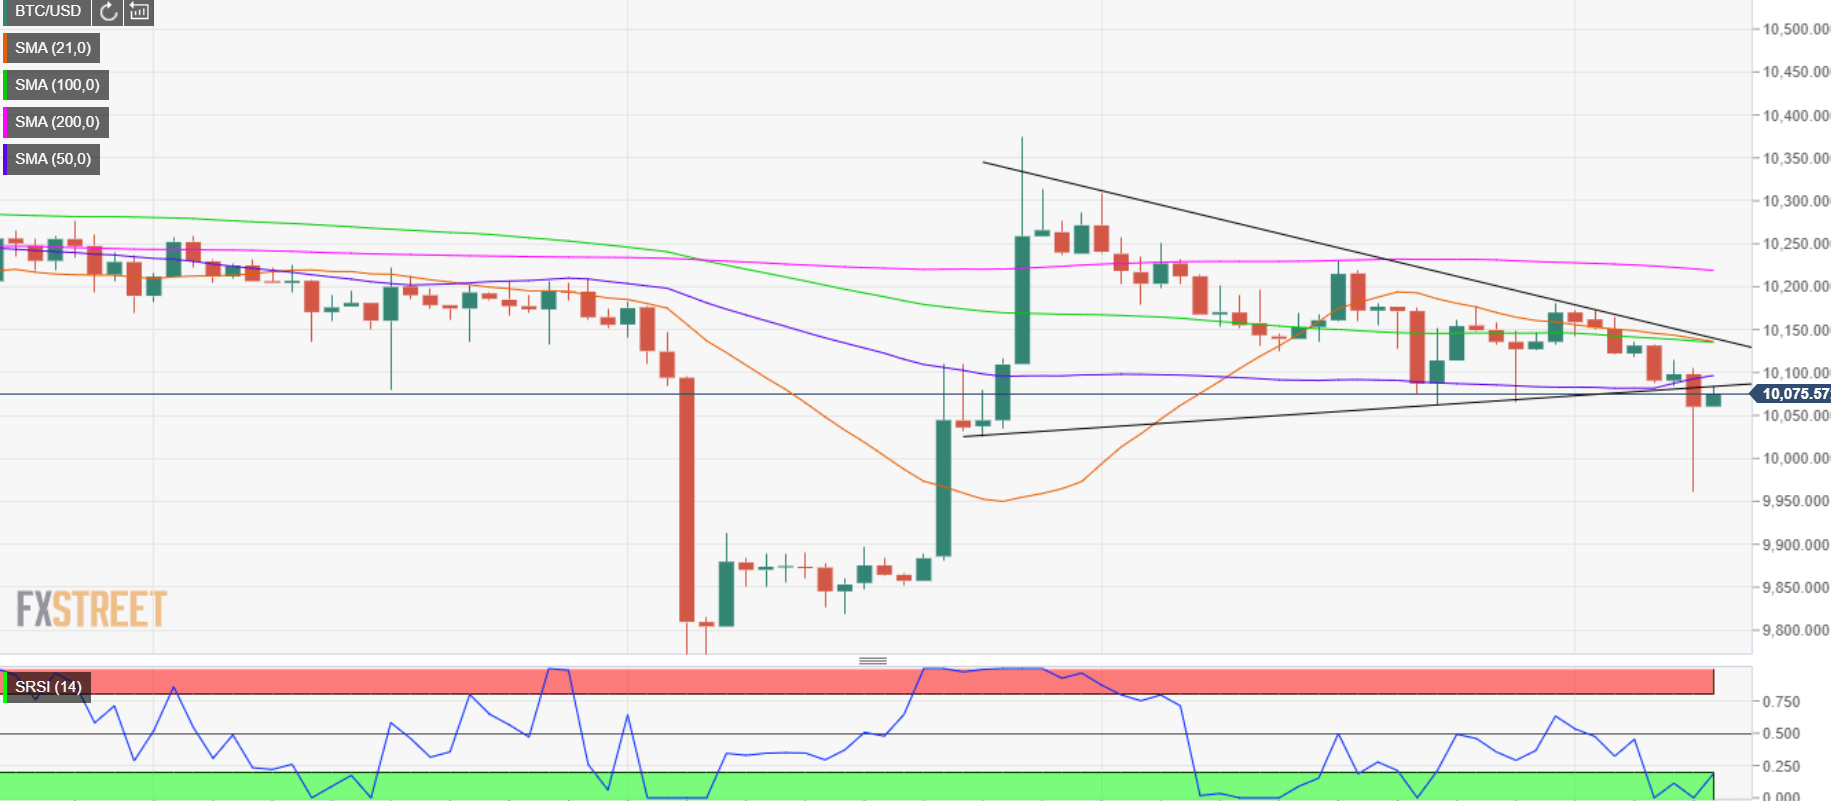
Therefore, a test of 9,800 levels (pattern target) remains inevitable, so long as the recovery attempts get sold-off into the key resistances aligned near 10,100 region – the confluence of the now support-turned-ascending trendline resistance and 50-Hour Simple Moving Average (HMA). Should the recovery gain traction above the last, the buyers could enter in and aim for a retest of the 10,140 level, where the descending trendline of the triangle, 21 and 100-HMA coincide. A sustained break above the last would confront the horizontal 200-HMA barrier, now at 10,220.
BTC/USD 1-hour chart
BTC/USD Levels to watch
