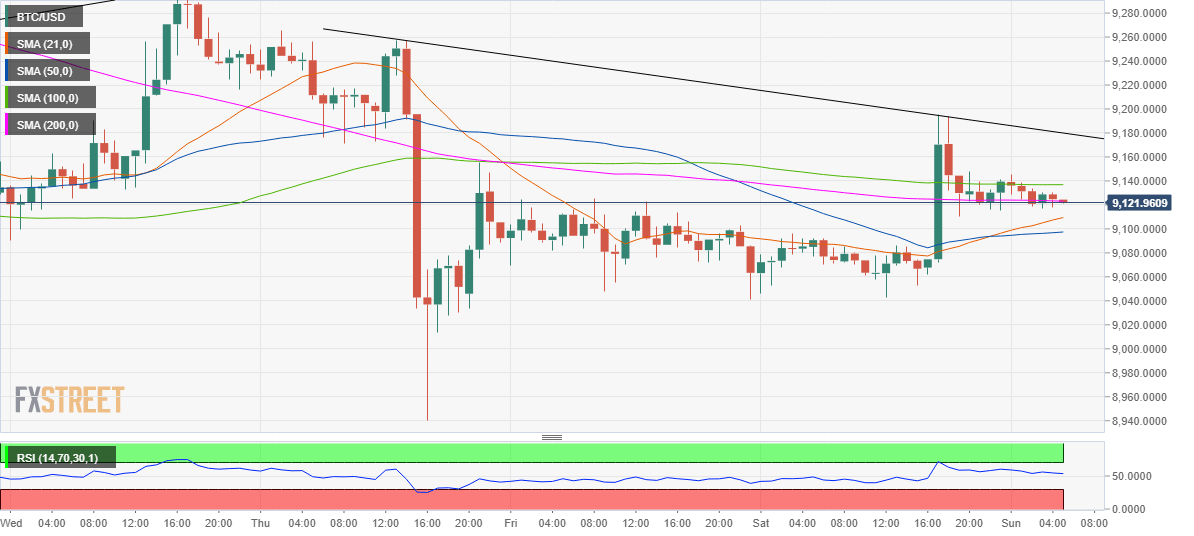
- Bitcoin consolidates Saturday’s brief spike to $9200.
- The No.1 coin looks to retest $9200 on the hourly chart.
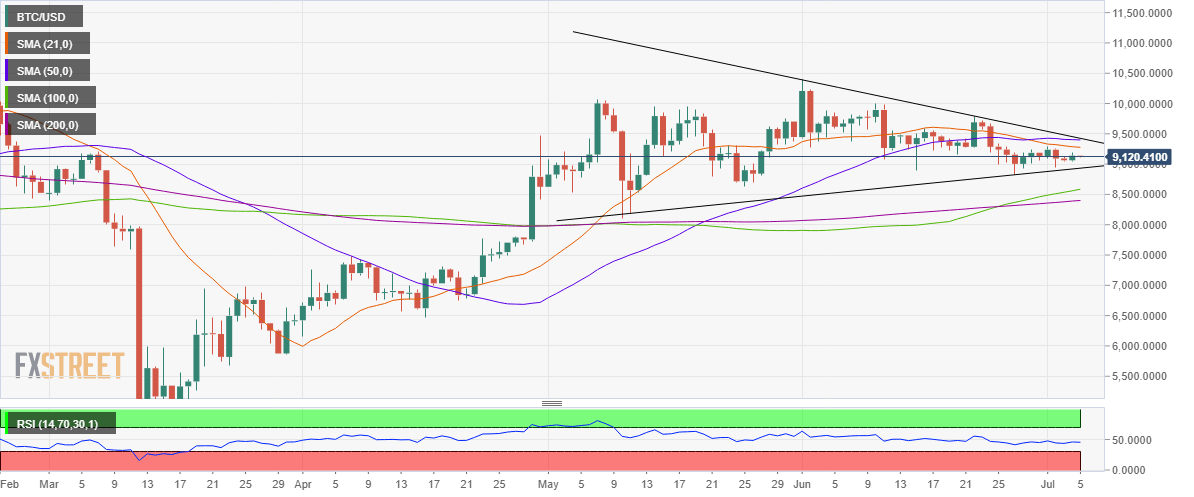
- The downside appears more compelling on the daily sticks.
Bitcoin (BTC/USD) has entered a phase of consolidation after reversing sharply from the late-Saturday spike to $9195.19 highs. The spot was sold-off at the $9200 level amid thin liquidity on the US Independence Day. The choppy trend is likely to extend across the crypto space as traders are away due to the extended weekend break. Markets are awaiting a strong catalyst to revive the near-term bullish momentum on Sunday. Meanwhile, the No. 1 coin is poised to end the week with modest gains, currently defending the $9100 mark. It enjoys a market capitalization of $167.69 billion.
Technical Overview
BTC/USD: Hourly chart
On the hourly chart, the price is back below the horizontal 100-hourly Simple Moving Average (HMA) at $9136.88 while clinging to 200-HMA at $9123.13 so far this Sunday. The hourly Relative Strength Index (RSI) trades neutral but above the midline, suggesting there is still scope for a fresh leg higher.
Meanwhile, the 21-HMA at $9109 had crossed the 50-HMA from below in the overnight trades, which also backs the case for another test of the $9200 mark should the 100-HMA barrier give way once again.
Until a fresh volatility wave hits the crypto space once again, the No. 1 coin is likely to range between the 100-HMA and 21-HMA in the day ahead.
BTC/USD: Daily chart
The price is trending in a potential symmetrical triangle pattern on the daily sticks since early May, forming lower highs over the past one month while the daily RSI continues to trade below the 50 level.
Further, the 21-daily Simple Moving Average (21-DMA) cut the 50-DMA from above last week, as the coin trades below the aforesaid DMAs.
Inferring from the above technical indicators, the path of least resistance appears to the downside in the coming weeks, given a lack of healthy support levels.
A breach of the rising trendline support at $8919.80 will confirm the pattern breakdown, opening floors for a test of the upward sloping 100-DMA at $8559. The next support awaits at the horizontal 200-DMA at $8390.97.
On the flip side, if the bulls succeed to take out the 21-DMA, the $9405/50 area will be a tough nut to crack. That supply zone is the confluence of the 100-DMA and the falling trendline resistance.
BTC/USD: Additional levels to watch


