- Bitcoin looks to post gains for seven straight week.
- Daily RSI indicator shows BTC/USD is technically overbought.
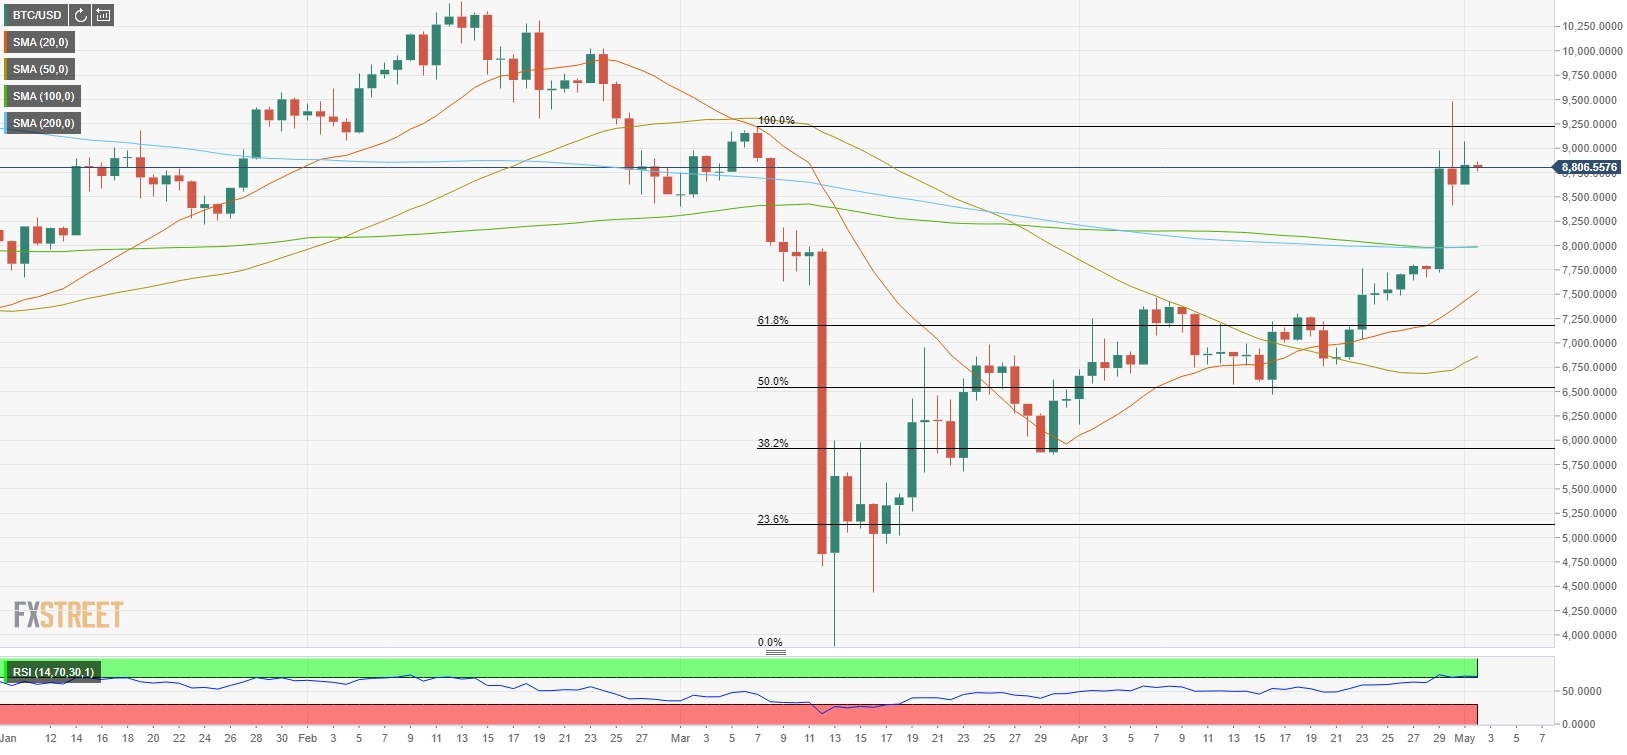
Bitcoin (BTC/USD) gained more than 13% on Wednesday and extended its rally on Thursday to reach its highest level since late February at $9,478. Following this impressive rally, the pair has gone into a consolidation phase and returned below $9,000. As of writing, the pair was posting small daily losses and moving sideways near $8,800.
Technical outlook
During Wednesday’s sharp upsurge, the pair broke above the critical 100-day and the 200-day SMAs. Although the pair’s outlook is likely to remain bullish as long as the price continues to float above those levels, the Relative Strength Index (RSI) on the daily chart is showing overbought conditions above 70.
If the pair makes a technical correction, $8,400 (Apr. 30 low) could be seen as the initial support ahead of $8,000 (psychological level, 100-day SMA, 200-day SMA). On the upside, $9,200 (Mar. 7 high) aligns as the first technical resistance before $9,480 (Apr. 30 high) and $10,000 (psychological level).
BTC/USD daily chart