- BTC/USD bounces off one-week low to regain $30,000.
- MACD, RSI favor sellers targeting 100-DMA, two-week-old resistance line, 21-DMA challenge buyers.
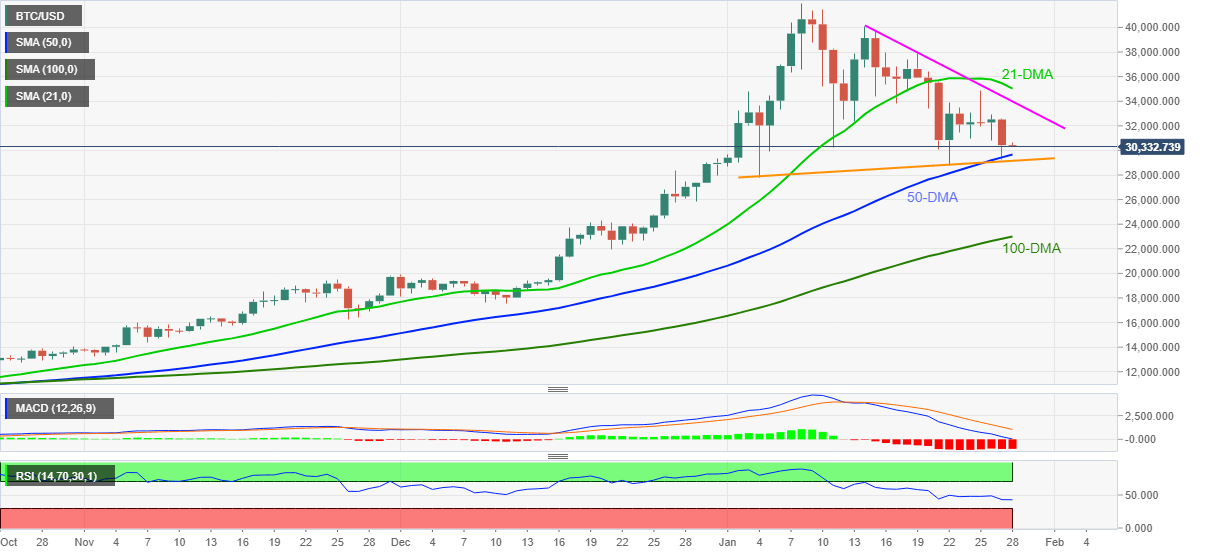
BTC/USD picks up bids around $30,400 during the early Thursday’s trading. In doing so, the crypto major consolidates the previous day’s losses, the biggest in a week, while staying above 50-Day Moving Average (DMA) and an upward sloping trend line from January 04. However, bearish MACD and downward sloping RSI line can challenge the corrective recovery.
As a result, BTC/USD sellers should remain hopeful unless the quote crosses a short-term resistance line and 21-day SMA, respectively around $33,980 and $35,010. Though, the odds of re-witnessing the $32,000 can’t be ruled out.
It should be noted that the quote’s upside past-$35,010 will initially target the $40,000 threshold ahead of probing the recently flashed record top of $41,987.
Alternatively, a downside break of 50-DMA, at $29,670 now, needs a daily closing below the aforementioned support line, currently around $29,150, to direct the BTC/USD bears toward the monthly low near $27,771.
During the quote’s further weakness below the monthly bottom, the 100-DMA level of $22,820 becomes the key to watch.
To sum up, BTC/USD is up for a corrective pullback but bears’ shouldn’t lose hopes.
BTC/USD daily chart
Trend: Pullback expected
