- Bitcoin’s recovery is capped by SMA-200 on a daily chart.
- The first critical support is located at $8,000.
Bitcoin (BTC) hit $8,416 high on Wednesday and retreated to $8,250 by press time. The first digital coin has been range-bound with a bearish bias on Thursday amid growing indecision on the market.
BTC/USD long-term technical picture
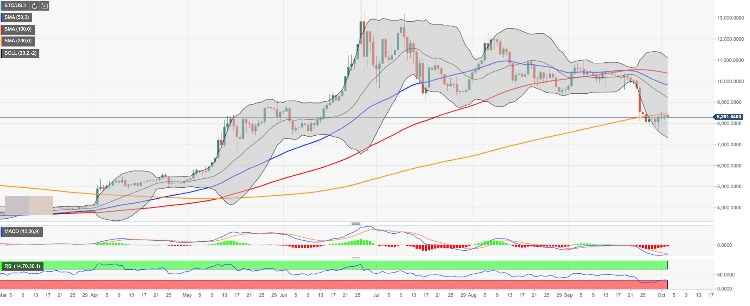
On a daily chart, BTC/USD recovery is capped by SMA200 (Simple Moving Average). The coin dropped below this line on September 26 – for the first time since February. Several attempts to break higher failed to yield results. From the technical perspective, this development may be interpreted as a bearish signal It confirms the lack of buying interest at this stage and makes the coin vulnerable to further losses.
We will need to see a sustainable move above this handle to mitigate the initial bearish pressure and allow for an extended recovery towards the next strong barrier of $9,000 followed by the lower border of the previous consolidation channel at $9,300.
On the downside, a move below $8,000 will become a signal to scrap bulls scenario for the time being and get ready for an extended sell-off with the next target at the recent low $7,700 the lower line of one-day Bollinger Band at $7,300.
BTC/USD, one-day chart