- BTC/USD keeps bounce off 22,378, takes the bids above 23,700.
- Sustained bounce off one-week-old horizontal support, MACD conditions favor buyers.
- Sellers need to confirm short-term rising wedge for entries.
BTC/USD rises to 23,733 during the early Wednesday’s trading. In doing so, the crypto major extends gains from a horizontal area comprising multiple lows since December 07, marked the previous day.
Also supporting the BTC/USD bulls is the MACD histogram that shows the receding strength of the bearish signals.
As a result, the quote is all geared up to challenge the recently refreshed all-time high of 24,299.12. However, the 24,000 round-figure can offer an intermediate halt during the rise.
In a case where the BTC/USD buyers keep the reins past-24,300, the upper line of stated rising wedge bearish formation, at 25,000 now, will be the key.
Meanwhile, a downside break of the immediate horizontal area near 22,300/270 will direct the BTC/USD sellers towards confirming the bearish chart pattern by targeting a downside break of 21,710 support.
Following that, the crypto pair may not hesitate to test a 200-bar SMA level of 19,477 during the theoretical target of around 15,000.
BTC/USD four-hour chart
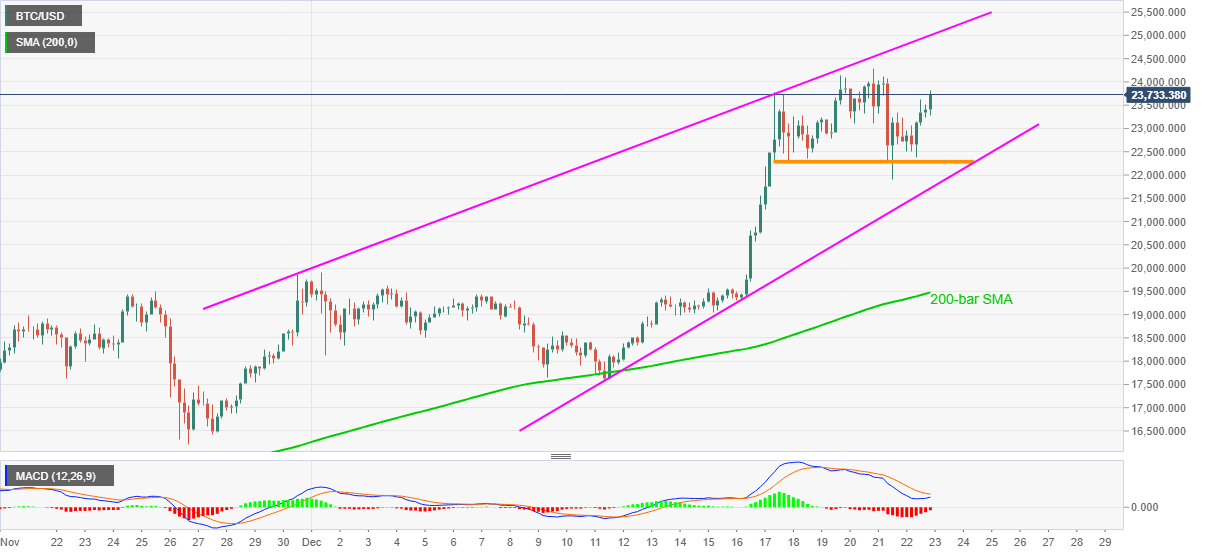
Trend: Bullish
