- BTC/USD teasing falling wedge breakout on the hourly sticks.
- 50-HMA could challenge the bulls’ commitment.
- RSI edges higher above the midline, backing the upside break.
Bitcoin (BTC/USD) is making another attempt towards the $40,000 mark in early Asian trades, having failed to find acceptance above that level last week.
From a short-term technical perspective, the no.1 coin is on the verge of confirming a falling wedge breakout should the price deliver an hourly closing above the falling trendline resistance at $38,713.
BTC/USD: Upside appears more compelling
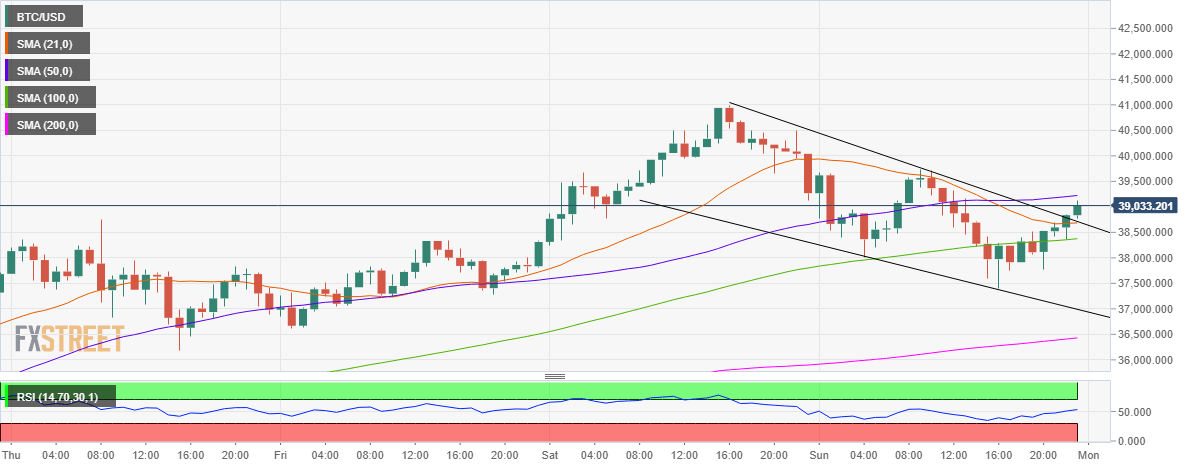
BTC/USD: Hourly chart
The level is the powerful confluence zone, where the 21-hourly moving average (HMA) coincides. On validation of the upside break, the bulls could meet immediate resistance at the 50-HMA of $39,223.
Acceptance above the latter could expose the $40K mark, beyond which the buyers would target Saturday’s high of $40,997 en-route the all-time-highs of $41,987.
The Relative Strength Index (RSI) is holding firmer, currently at 53.29, above the midline. This makes a stronger case for the additional upside.
Alternatively, the abovementioned key confluence area around $38,720 could be tested on any pullbacks.
Further south, the horizontal 100-HMA at $38,376 could be put to test. A sharp sell-off could be in the offing below the latter, opening floors for a test of the falling trendline support at $36,991.
BTC/USD: Additional levels to watch
